
Garmin Sleep Tracker – 1 Week of Data
Garmin Sleep Tracker – “It’s Not the Night Before That Matters. It’s All the Nights Before That.”
[caption id="attachment_12846" align="aligncenter" width="1024"]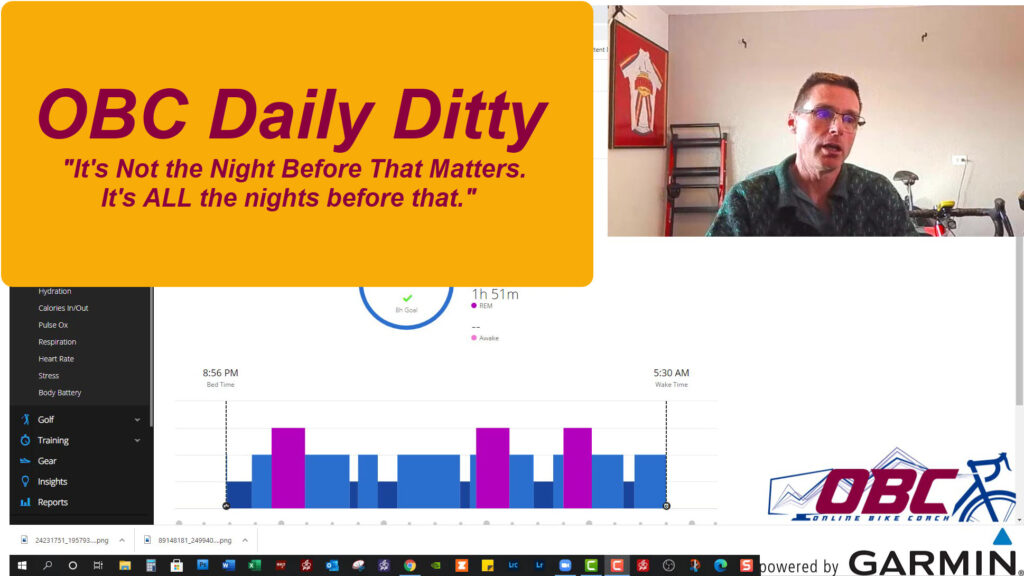 Watch the Video to see how I’m studying my sleep, so I can then make changes to improve upon it.[/caption]
Garmin Connect Sleep Tracker – With Sominex
Garmin Connect Recorded NO Time Awake Last Night!
[caption id="attachment_12800" align="aligncenter" width="300"]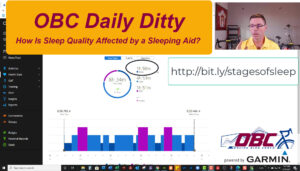 Did a Sleeping Pill help me rest better? Am I ready for a breakthrough effort?[/caption]
Continuing down this path of measuring and analyzing my sleeping pattern, Garmin Connect showed what my sleeping pattern was after I took a sleeping aid.
Garmin Connect – Let’s Talk About SLEEP!
Garmin Connect Has A Sleep Tracker That Can Help You Optimize Sleep and Recovery!
[caption id="attachment_12776" align="aligncenter" width="300"]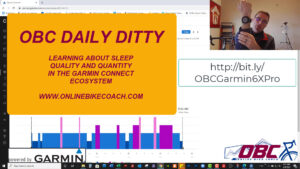 The Garmin Connect Sleep Tracker provides assessment for sleep quality and quantity.[/caption]
The Garmin Connect Ecosystem is RICH with features that are either under-utilized or perhaps are misunderstood. I have wanted to explore Garmin Connect with my followers for a while now. I think the Sleep Tracker is a great place to start.
Garmin Connect, when paired with any of…..