
The Power Illusion: Why Your Suspension Setup and HRV Dictate Real Speed
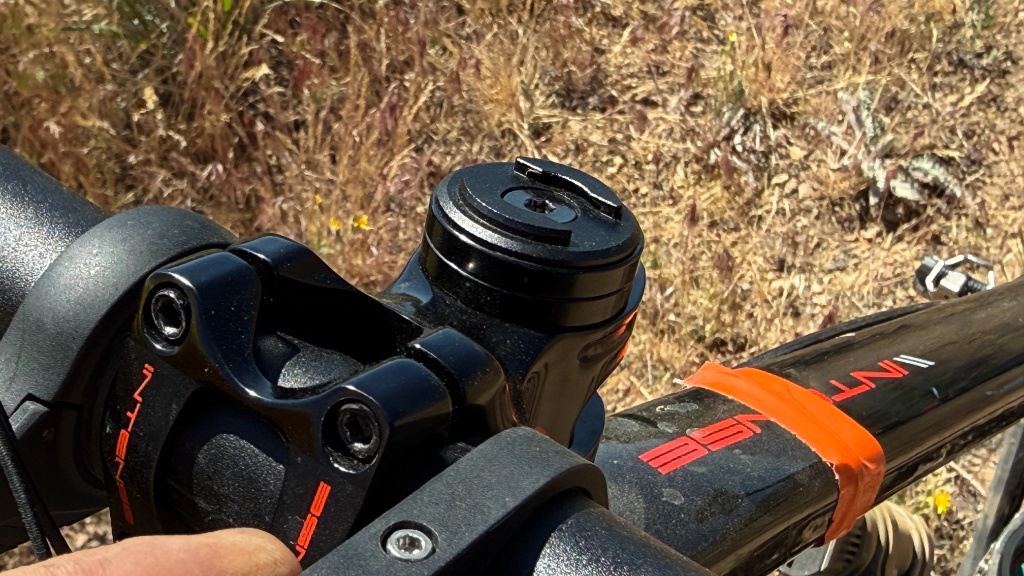
Chasing Ghosts on Peavine: The Ecology of Speed By Coach Richard Wharton • May 27, 2026 Heading out from the Peavine Mountain Hoge Road Trailhead to collect raw biometric and suspension telemetry across the Halo Loop. Part 1: Physiology-First Cycling Training, the Weight, and the Climb Metrics It has been months since I last pointed […]
The Anatomy of a Good Ride; Physiology, Recovery, and the Portola Block

The Anatomy of a Good Ride: Physiology, Recovery, and the Portola Block I’ve always said that success on the bike isn’t a roll of the dice; it’s a deliberate convergence of external work and internal readiness. This week, I conducted a deep cycling physiology analysis of the Portola block to prove how disciplined recovery yields […]
Rocky Terrain Suspension Efficiency: The Open vs. Locked Debate

May 7, 2026 Rocky Terrain Suspension Efficiency: The Open vs. Locked Debate; A Peavine Challenge In November 2025, I conducted a “Physiology First” experiment on Reno’s Peavine Mountain to analyze rocky terrain suspension efficiency. This ride has since become the archetype and benchmark for my 2026 training season. The mission was simple: Two laps on […]
The Garmin Ecosystem: Why Your Watch is More Important Than Your Power Meter
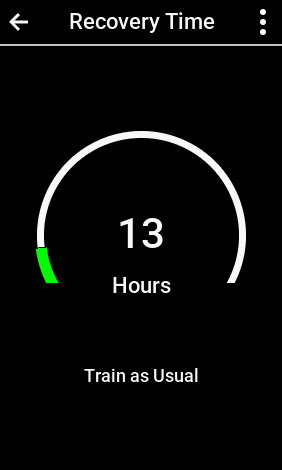
Garmin Recovery Time: Why Your Watch Beats Your Power Meter By The Garmin Guru | April 24, 2026 Understanding Garmin Recovery Time is essential for any athlete following a “Physiology First” approach. As a coach with over 20 years in the industry, I know that your bike computer is only half the story. To truly […]
Garmin Stamina VO2 Threshold: Mapping the Fatigue Trigger
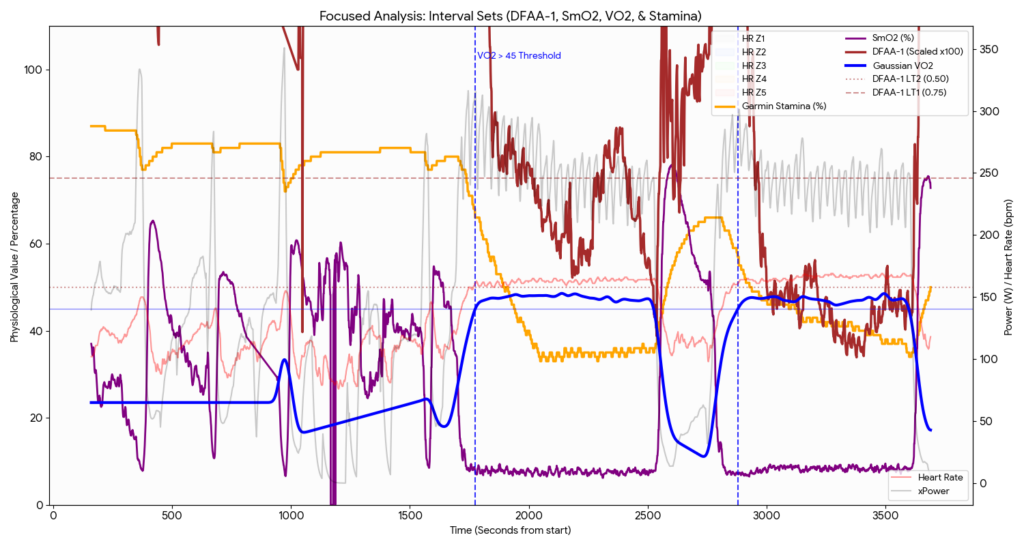
Garmin Stamina VO2 Threshold: Mapping the Fatigue Trigger In my ongoing pursuit of the “Physiology First” training approach at Onlinebikecoach.com, I have used the Garmin Stamina VO2 Threshold to map exactly where my internal stability ends and metabolic exhaustion begins. To build a more resilient aerobic engine, I need to know my limits. With my […]
Vo2Max and Mountain Biking

Mountain Biking Requires Riding at Vo2Max! CAUTION – THIS POST IS NERD-HEAVY! IT IS DEEP IN THE WEEDS! DO NOT HESITATE TO ASK QUESTIONS!!!!! Ever since I received my Vo2Master back from my friend and code buddy in Canada, I have been collecting data on inside and outside rides. Not long ago, I rode two […]
The Road to 300 Watts FTP
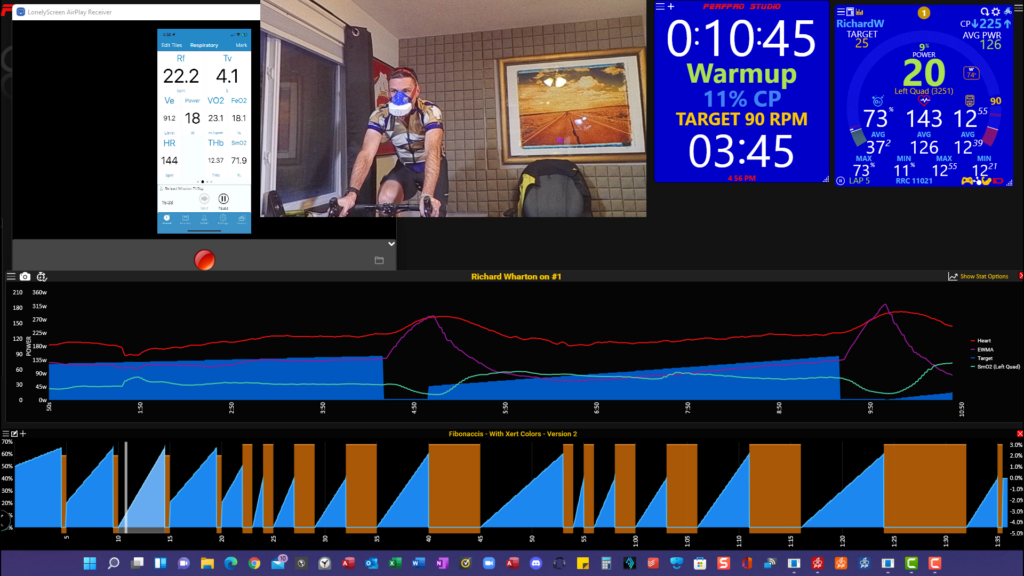
Right Now, It’s NOT about 300 Watts; It’s About Raising LOWER THRESHOLD
The goal of base is to train the body for Economy. Stamina is the fundamental Pillar for Polarized Training. When you train using DFAA-1, you can get a clearer picture of how your body is responding to the training. Wattage and traditional heart rate become
Xert Breakthrough With Physiological Metrics
Xert Is On Board With Some Serious Physiological Observations My Client, Dusty, achieved an Xert Breakthrough while I observed his Physiological Metrics. This is Part 2 of what will now be a 3-part series of videos. In Part 1, I described the physiological phenomena behind a good warmup. Today, we’re going to show how Xert […]
Xert Breakthrough With Physiological Metrics Part One – Warmup
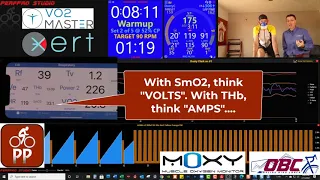
We Use a Moxy Monitor, a Vo2 Master, PerfPro Studio, and Xert To Show a PROPER Warmup I continue to learn something almost daily when it comes to mixing Physics and Physiology. The data that we get and use for wattage training, is almost always complemented by the information I collect from physiology. We have […]
Xert FTP Tested
Xert Claims my FTP (Functional Threshold Power) Sits At 265 Watts. Is It Accurate?
I’ve always wondered if calculated Functional Threshold Power Values are accurate. Since 2017, however, I have relied on the Xert FTP value.
For years, we relied on the “20-Minute” Test. Riders would perform a 20-Minute effort, all out, and then subtract 5% from that value. The new number was considered “Threshold”.
Later, physiologists looked at 90% of a 3-Minute Maximal Effort.
There’s the 5-1-5 test….
Step Tests (25w steps every 3 minutes)…
Ramp tests (15-20w every minute)…
The latest ‘Testing’ asks for a 20-minute, 5-minute, 1-minute, and 5-second effort.
[caption id="attachment_12832" align="aligncenter" width="1024"] Xert Claims that my FTP (Functional Threshold Power) is at 265 watts. Let’s find out how accurate that really is.[/caption]