Online Bike Coach

Where Cyclists and Triathletes get Faster/Stronger/Leaner/Sooner

  • Shop
  • Contact Us
  • What we do.
  • How we do it.
  • Why it works.
  • Who we are.
  • What you’ll need.
  • Let’s get started.
  • Blog
  • My account

Archives for February 2023

Feb 28 2023

Garmin Performance Condition Metric and the Link to HRV Stress

The Performance Condition Metric is Another Indicator of Preparation for Intensity (or Easier Riding)

I’m now about 9 days into measuring my HRV Stress on the Garmin, and it definitely seems to correlate with my sleep quality, as well as my hydration values. But there is another metric that pops up a few minutes into my rides. It’s the ‘Performance Condition‘ metric, and it is also using Heart Rate Variability (HRV).

Remember – Heart Rate Variability is a way to measure the variation in milliseconds between R-Wave contractions in the heart. The more variable the values, the more rested the heart is. The more consistent the values, the more stressed the heart is. Garmin bought FirstBeat Technologies several years ago to integrate HRV technology into their entire lineup of products and services. So it’s important to understand what this stuff is telling us. This is why I’m writing these blog posts.

Garmin’s Definition of Performance Condition

Garmin’s Performance Condition Metric is pegged to their HRV algorithm. In SOME cases, they have come up with a fairly accurate assessment of an individual’s Vo2max. Vo2max is defined as: “Volume of Oxygen Uptake, measured in Liters per Minute (Absolute), or Mililliters per Kilogram per Minute (Relative). Notice that one uses weight. This value can be altered through weight loss and gain, as well as fitness conditioning. Here is their definition…

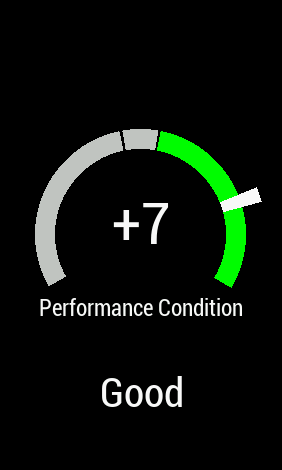
The Performance Condition metric is a real-time assessment of your ability to perform compared to your average fitness level. This metric ranges from -20 to +20 with each point representing approximately 1% of the VO2 Max set on your device. During the first 6-20 minutes of an activity the device will alert you to your current Performance Condition. This can also be used as an indicator of fatigue level, especially at the end of a long activity. Performance Condition is calculated using the following:

  • Speed
  • Heart rate
  • Heart rate variability
  • Power

Here’s an example from one of my recent rides…

Garmin Performance Condition
The Garmin Performance Condition Metric pops up at some point between 6 and 20 minutes into most of my rides, indoors and out. It uses HRV (Heart Rate Variability), wattage, and basic HR values to come up with a value between -20 and +20. It’s also related to Garmin’s estimate of your Vo2max, which in my case, is fairly accurate, though YMMV.


This Value Will CHANGE Over the Course of a RIDE

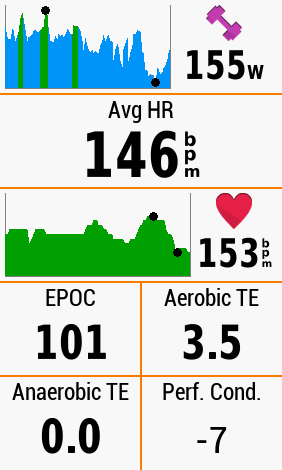
Take a look at this page I built on my Garmin 1030. There are other metrics on the page that I will write about later, but focus on the “Performance Condition” value, located in the lower right corner of the page.

Garmin Performance Condition Value Changes Over Time.
The Performance Condition Field (Lower Right) will change over the course of a ride as HRV values change. Make sure you have a good chest strap in order to ensure the best data stream to your head unit.


Here’s where this metric gets interesting, and why I think it deserves some attention.

Look at the definition above. Performance Condition looks at your Vo2max, then heart rate, heart rate variability, and wattage. Then, remember my ‘happy heart/stressed heart’ summary about HRV.

A Happy Heart beats because it wants to.

A Stressed Heart beats because it HAS TO.

If a cyclist is 30 minutes into a ride and their Performance Condition starts to drop, well, that’s a sign. If Performance Condition starts to actually CLIMB or stays STABLE, that’s another indicator.

USE THE HRV STRESS VALUE IN CONJUNCTION WITH PERFORMANCE CONDITION

My new morning routine now involves measuring HRV Stress, usually after coffee, news and email. But I also try to pay attention to my Performance Condition Value, once my ride has begun. When I ride SOLO, the Performance Condition Value can help me better understand the preparation for a ride. I’m still figuring it all out, but Clifton Duhon of NBS Nutrition has a great and relevant allegory….

“A good ride doesn’t start with a meetup in a parking lot. A good ride starts the night before the ride, with good sleep. A good ride starts with the meal that you’re having that night, so that you get to sleep better. More good rides start with better preparation via nutrition and hydration in general. Sure, we all want to talk about on-bike hydration strategies and what powders yield the most miracles. But the chronic habit of good meals, in the proper proportions, which lead to better sleep, over time, is what really matters most. Nutrition via calories and a chronic hydration and sleep plan matter more than any other ride accessory.”

If I wake up and my HRV Stress is HIGH, then I’m going to look back about 12-16 hours to determine just how I might have messed up my preparation. Did the dogs sleep on top of me? Was it too hot in the bedroom? Did I consume too much alcohol (I’m 1 week sober as I write this, as an experiment in better sleep and recovery)? What was my hydration status?

The next step on the ride is to watch for the “Performance Condition” to pop up. If THAT VALUE, combined with the HRV STRESS value, is…

  • Negative? Well, I’m rolling back into the garage.
  • If it’s POSITIVE, I’ll ride and WATCH FOR THE DECLINE in the “Performance Condition” Field to determine how and when I should return home or curtail the duration.
  • If HRV Stress is Moderate and Performance Condition is Neutral or Positive, I’ll head out and just pay attention to the Performance Condition, so see if it remains fairly flat, or if it declines quickly.
  • Sometimes, Performance Condition WILL RISE during a ride, usually when I’m riding a little more intensely. If that’s the case, I’ll work my miles and minutes, and see if it starts to decline later in the ride.
HRV Stress and Performance Condition in Garmin Connect.
In this ride, which was about an hour long, HRV Stress rose and Performance Condition Fell starting about halfway into the ride. I wanted to follow the trail of Performance Condition, but I quit when it was obvious that my body was not getting anything out of the ride that was meritorious.

CONCLUSION

I’m slowly coming full circle on the entire concept of Garmin and FirstBeat’s efforts to integrate their interpretation of Heart Rate Variability measurements and conclusions into their metrics. In the last post, I discussed HRV Stress using a 3-minute test. But this post augments that information with the Performance Condition value, and how that relates to Vo2max, and whther a ride, or any exercise, is beneficial or not. Use it to help you determine early, just how hard you might need to go. You can also use it to better strategize those days and hours prior to an event or weekend ride.

I’m still a student, and I’m going to follow this thread with myself and you. Let’s learn it together, and see what we can glean.

I will also start incorporating Garmin’s Hydration Tracker and Sleep Score, to see if we can get a more Holistic picture of fitness and preparation via the Garmin Connect Ecosystem.

Thanks for reading, and ENJOY THE RIDE.

Share this:

  • Click to share on Facebook (Opens in new window) Facebook
  • Click to share on X (Opens in new window) X

Like this:

Like Loading...

Written by Richard Wharton · Categorized: Garmin Connect, Garmin Fields · Tagged: Garmin, Garmin connect, Garmin Performance Condition, Garmin Performance Condition Feature, Performance Condition

Feb 25 2023

Measuring HRV Stress with Garmin

Garmin HRV Stress Feature

Garmin HRV Stress Test
The Garmin HRV Stress Test might be a useful guide for daily cardiovascular exercise.

I believe that the Garmin HRV Stress measurement feature is completely under-utilized. Garmin has a LOT of features on their head units and watches that are underutilized. When Garmin purchased FirstBeat, the premier company that has studied Heart Rate Variability and its’ applications for health, I thought they would bring this information to the masses. Well, it’s there, but it’s still not well-promoted. This blog post is the first of many that I’m going to use to study HRV Stress, long-term.

What is HRV (Heart Rate Variability)?

I have been studying Heart Rate Variability since the early 2000’s, when the technology was paired with Suunto products. For years, Polar Oy was considered the leader in heart rate measurements, but the Suunto T6 really impressed me with how they used FirstBeat’s technology to explain cardio fitness. The distilled version of Heart Rate Variability is this;

“NO TWO BEATS ARE THE SAME.” 

A heartbeat is usually pegged to the ‘R’ wave, which is the contraction of the Left Ventricle. The original heart rate measurement looked at a rolling 6-second average of heart rate, to come up with a value, usually between 35 and 220. While we still use that measurement of exercise intensity, the more modern way is to look at the millisecond variation between each beat. When a heart is ‘happy’ or under little stress, it basically beats when it wants to. When a heart is under more stress from exercise intensity, the variability diminishes. The DELTA between beats, over time, is called the “Root Mean Square Standard Deviation”, or “RMSSD”. Heart Rate Variability (HRV) measures that Delta, and runs it through an algorithm based on FirstBeat’s Two-Plus Decades of Science and Publications. The solution, in this case, renders a ‘Score’ between 0 and 100, to assess an individual’s preparedness for exercise.

I have been a fan of a further evolution of this measurement via DFAA-1, but this measurement is about general health and wellbeing.

The Garmin HRV Stress Test

I use a Garmin 1030, but the Stress Test can be found in most of the modern Garmin head units and watches. You will need a chest strap, and honestly, a quiet place where you can stand still for 3 minutes. THERE SHOULD BE NO DISTRACTIONS. If the head unit or watch is set to send and receive messages or news clips, the test will fail. If you like soft music, headphones or earbuds might be appropriate. No kids, no pets. Just you, your head unit or watch, and a brief period of time.

This video explains how I get to the HRV Stress Test feature on my particular Garmin. Once the test is over and I have a result, I usually take a screenshot of the results.

Results

The goal with this series on the Garmin HRV Stress Test is to determine whether the HRV Stress Score corresponds to my fitness and training on the bike. The quick, short summary of the scores is like this: When the score is LOW, Garmin claims that you might have more success at a moderate or high intensity or high volume day. If the score is in the Medium Range, LSD or ‘Zone 2’ might be appropriate. If the score is HIGH, well, light exercise or no exercise is appropriate.

I intend to look at the ENTIRE Garmin Connect Ecosystem to determine my preparedness for exercise. This includes Garmin’s Sleep Score, the Body Battery, and even Garmin’s Hydration Tracker.

Why?

Because it’s all in one ecosystem via Garmin Connect. A combination of rugged wearables, head units, and software. Furthermore, I don’t think anyone has objectively followed these physiological measurements like this and presented them this way. The information has been there for years, but I honestly don’t know if the information is empirically valid or not. The science and the papers say ‘yes’, but the individual experience just has not been presented on the internet.

Let’s see where this information leads. Thanks for reading, and…

ENJOY THE RIDE!

Share this:

  • Click to share on Facebook (Opens in new window) Facebook
  • Click to share on X (Opens in new window) X

Like this:

Like Loading...

Written by Richard Wharton · Categorized: Fitness, Garmin Connect, Garmin Fields · Tagged: Bike Coach, Cycling Coach, Garmin, Garmin connect, HRV Stress, HRV Stress Test

Feb 22 2023

2023: New Home, New Goals, New Services, New Discussions

New Home: Sacramento, California, USA!

New OBC Headquarters
New OBC Headquarters – complete with Wild Turkey!

Hey everyone, I can’t believe that I’ve landed and set up shop in our new home here in Sacramento, California. Honestly, I haven’t been a Californian since 1974, so this is definitely going to be a new experience.

Online Bike Coach has been a stalwart pillar of coaching and information since its’ inception in 2003. I’ve been coaching cyclists since 1993, so this is my 30th Anniversary as a Cycling Coach! While we’ve learned, taught, and experienced many things, it’s time to reset the foundations and make the NEXT 15 years even stronger.

New Goals

New OBC Logo White PCThe Goals for Online Bike Coach going forward are simple: Offering cycling-based training classes and programs for fitness, health, longevity and performance. To do this, I am going to migrate what was a successful 15 years of In-Studio training, over to online Group Classes, via www.vqvelocity.com. Online Bike Coach will offer LIVE and RECORDED classes, multiple days of the week, with different goals and agendas. We’ll work on the FUNDAMENTALS; Aerobic Fitness, Anaerobic Work Capacity, Stamina, Strength, and Speed. You can take as many classes as you wish, pop in here and there for a quickie, or replay any one of the rides in the library as it grows. Classes will be held in the Pacific Time Zone, but I’ll be posting hours that fit client needs across the four major time zones in the US, and will consider time zones in Europe and Australia as well if there is demand.

Traditional Coaching will also continue, but I’ll be increasing the hybrid approach of using the most recent cardio-vascular technology and assessment information via Garmin head units and wristwatches for Aerobic Conditioning. For those who subscribe to the ‘Polarized Training’ approach (and I use both Polarized and SweetSpot methods, depending on each rider’s needs or time availability), the latest ‘Stamina‘ Feature from Garmin, and other metrics for supra-threshold and vo2 that I’ve reviewed and used before.

We want time-tested, scientifically validated metrics, but I still fear that most producers are not interested in advancing known science, but are instead focused on profit. I refuse to be a Tent Preacher, and will emphasize known, published science where I can. Where I cannot, I’ll do the scientific studies using my own instruments, and will publish the results here and elsewhere if I can.

New Discussions

The New Discussions are not necessarily new, but they’re worth a refresh in this blog, on YouTube, and in the general public domain. I intend to blog regularly about the following:

New Hand Signals

  • Cyclist Safety. Cycling is a safe sport. Reat that ad infinitum. CYCLING IS A SAFE SPORT. There are ways you can ride and present yourself in urban and rural settings that will increase your safety, confidence, and competence when out on the road. There’s also technology that can improve your awareness and visibility. Beyond a few one-and-done videos, I intend to produce blogs and videos that show long-term work on these concepts, products and methods. For me, it’s the only way to save the sport from being an indoor-only, virtual-ride product.
  • Training With Technology. I’ve always been a fan of Science and Technology, and cycling is the perfect meld of physics, physiology, and electronic tools of observation and analysis. But there seems to be an information overload, a plethora of features, and not much explanation or distillation of the information provided. I intend to change that, with more regular posts.
  • Garmin Connect Features. Garmin Connect is the data-collection site for so many of the metrics I have mentioned above. However, I’ve searched high and low on the internet to try and find a coach who actually uses these metrics on a regular basis, to COACH an athlete. I also see the semi-artificial intelligence programs found in Garmin Connect, and I wonder about their effectiveness. Some posts on Reddit have been all I’ve seen. The results seem to be all over the place. It makes me wonder if there might not be a better way to look at the metrics provided, and then use that information to better judge and guide fitness training. We’ll see.

I have been coaching now for thirty years; a lot has changed. A lot has not. One historian of cycling said that in the history of humanity, cycling is arguably the only activity that EVOLVED into Recreation, then Utility. It spawned the Tire Industry (Dunlop), which further altered civilization. I think we need to reconnect the social benefits of cycling with 21st century mobility and mental health.

https://youtu.be/ZYwhvD2-fYw

CONCLUSION

The Cycling world has gone ‘U’ shaped; we’ve got people in a really poor demographic using bicycles for utility, and we’ve got really rich people using bicycles for recreation. The Middle Class and cycling have largely disappeared. For example, how many of you readers rode your bikes to school? How many of you have children that ride their bikes to school? How many of you have grandchildren that ride their bikes to school? It’s a vexing question, and I’d like to look into the perceived problems and factual solutions.

That’s really about it for now. I’m going to get on with the day, and I’ll start posting more work, more regularly, going forward. I know I’ve promised that before, but I have the venue, the time, and the desire to pursue this.

Thanks for reading, and ENJOY THE RIDE.

Share this:

  • Click to share on Facebook (Opens in new window) Facebook
  • Click to share on X (Opens in new window) X

Like this:

Like Loading...

Written by Richard Wharton · Categorized: Garmin Connect, news, Uncategorized · Tagged: bicycle coach, Bike Coach, Cycling Coach, Garmin connect, Wattage Training

  • Shop
  • Contact Us
  • What we do.
  • How we do it.
  • Why it works.
  • Who we are.
  • What you’ll need.
  • Let’s get started.
  • Blog
  • My account

Copyright © 2025 — Online Bike Coach • All rights reserved.

info@onlinebikecoach.com   |   (1) 214-616-9850   |     |  

  • Shop
  • Contact Us
  • What we do.
  • How we do it.
  • Why it works.
  • Who we are.
  • What you’ll need.
  • Let’s get started.
  • Blog
  • My account
%d