Garmin 1040 Post-Ride Analysis
The Garmin 1040 Is the Ultimate Garmin Bike Computer –
But it’s the Post-Ride Analysis That It Gives, Which Makes Such a Difference
I’m now about 4 weeks into my return to fitness, using the Garmin Connect Ecosystem. I know that some of the metrics are controversial. That said, I’m enjoying the Garmin 1040’s Post-Ride Analysis Reports and Physiological Interpretation of the data via the head unit and Garmin Connect.
Before we go any further, if you like what you’re reading here, then:
Let’s Begin With This Chart – Courtesy of Garmin Connect

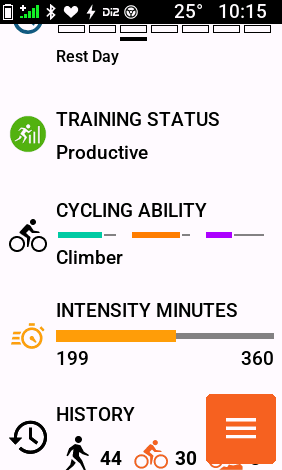
I begin most rides by looking at the following screen when cycling.
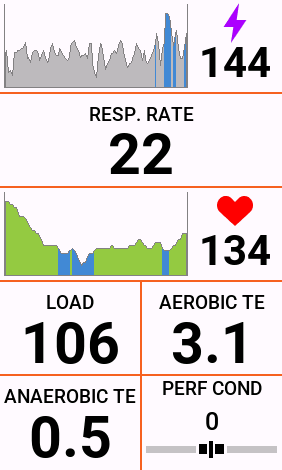
The knowledge that the first chart provides, is used by me mentally, to help “Temper ACTION with Wisdom“. In other words, we all want to get fit, fast. Getting fit, however, can’t be done quickly. It takes time. We have to think of it like a slow cooker and stew. Riding slower, longer, and with an AUTONOMIC system that responds to our stimulus. This entire exercise is about learning whether this works. I’ll write up a 28-day update soon, but by following this new information WHILE RIDING, it leads to tempered action and greater wisdom on heart health and aerobic fitness.
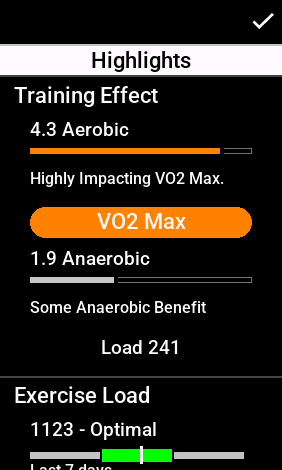
Ride’s Over – Now What?
When a ride ends, as long as the bike computer is linked to a phone or wifi connection, the data gets uploaded to Connect, and summaries are presented on the Garmin head unit itself.
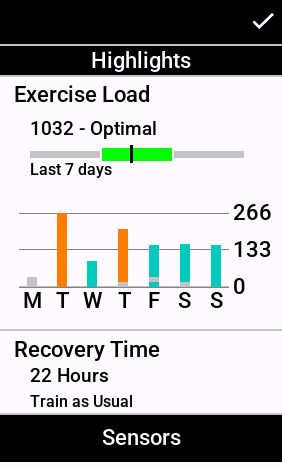
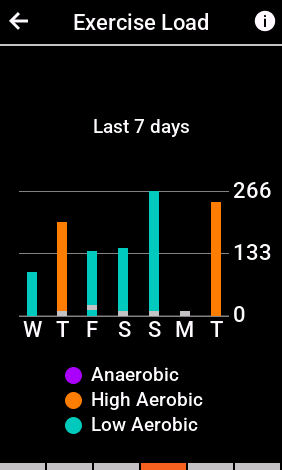
The second area of the screen reveals my 7-day history of EPOC/LOAD, and the color-coding tells me whether it was ‘LOW Aerobic’ ‘HIGH Aerobic’ or even ‘Anaerobic’. A few of the vertical bars have a grey area. These are ‘other’ aerobic events, like hikes or dog walks.
The third area is somewhat controversial, and it’s about ‘Recovery Time‘. Recovery Time on the Garmin Connect ecosystem has largely been a frustrating thing to interpret; If a Recovery Time states that you need THREE DAYS of NO EXERCISE to recover, well, that makes training and planning to train much harder. Instead, the Garmin 1040 and now the 840 and 540, through post-ride analysis, use this time more generally. It provides a value or comment the next day, with their algorithmic sense of what might or might not be appropriate. The “Train as Usual” is that judgment by the Connect Ecosystem.
Garmin 1040 Post-Ride Analysis Page 1 – TRAINING STATUS
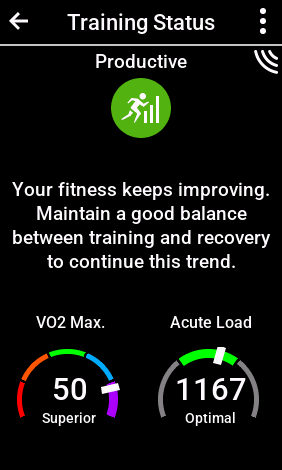
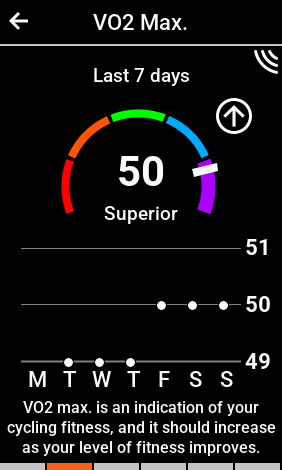
VO2 Max
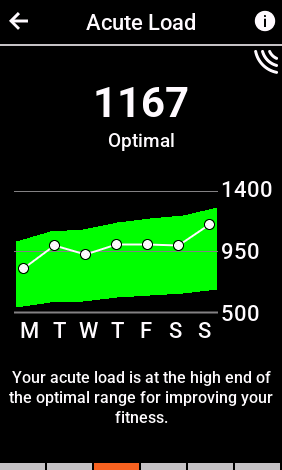
ACUTE LOAD
EXERCISE LOAD
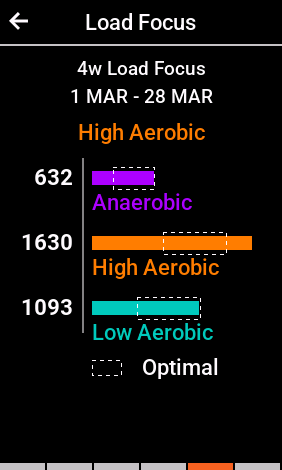
LOAD FOCUS
CYCLING ABILITY
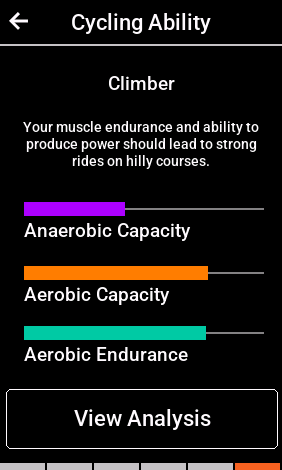
CYCLING ABILITY – ABILITY LEVEL ANALYSIS
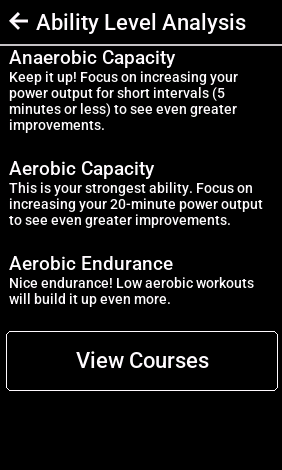
I’m NOT going to click on ‘View Courses’ because I don’t have enough time outdoors in this town, and I want to write a separate block on this feature entirely. So, some other time.
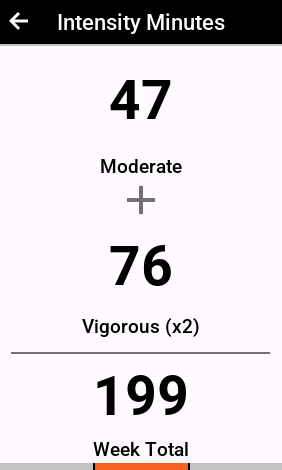
Garmin 1040 Post-Ride Analysis Page 2 – What Are “Intensity Minutes”?
The TL:DR about “Intensity Minutes” is that they’re a general roundup of Medical and Physiological Scientist Prognoses for maintaining and improving overall health and fitness. The Garmin 1040 Post-Ride Analysis (and Garmin Connect Ecosystem) defaults to 150 minutes of moderate effort in, and 75 minutes per week of high intensity effort in as well. This can be changed, but I haven’t really looked to find out where. I’m not sure how the Garmin calculates “Moderate” and “Intense”, but it’s probably connected to traditional heart rate zones. In this metric, High Intensity work gets counted 2x towards that overall value. Here’s what it looks like when you tap on the bar.
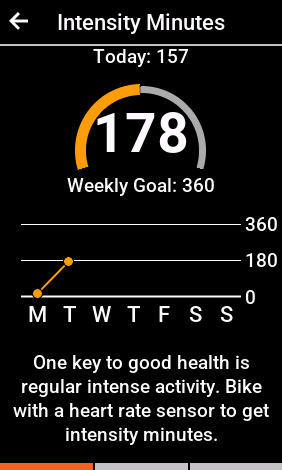
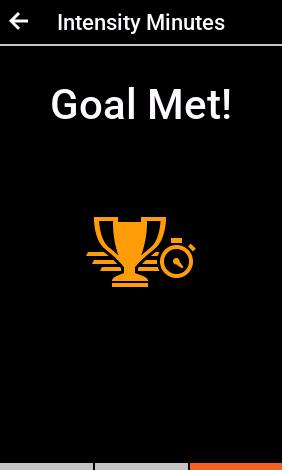
When you meet your goal for the week, it looks like this!
Garmin 1040 Post-Ride Analysis – CONCLUSION
I’m really falling in love with Garmin’s Ecosystem. I think I see the Method to their Madness. They’ve got a science-backed Heart Rate Variability Protocol with the purchase of FirstBeat. They’ve implemented the fitness features into their bike computers, watches, and scales. The Garmin Connect Reports show summaries. the On-Screen Garmin 1040 post-ride analysis gives a pretty good review of what was accomplished on the bike that day, that rolling 7-days, and the rolling 28-days. Follow the guidelines, use the EPOC, Aerobic TE, Anaerobic TE, and “Performance Condition” when riding, especially for Base, Zone 2, LSD, whatever you want to call it. I always aim for a ride between 80-150 EPOC, an Aerobic TE above 3.0, and as low an Anaerobic TE as I can get away with, indoors or out. I’ll work on the Anaerobic stuff later. I still want to see how far I can go following the Aerobic TE and EPOC.
The metrics at the end of the ride are certainly helpful. It gives me something to think about for the next day, and the next, and the next. It’s ‘Dynamic Progression and Periodization.’ It is NOT static.
Thanks for reading, and ENJOY THE RIDE!