Online Bike Coach

Where Cyclists and Triathletes get Faster/Stronger/Leaner/Sooner

  • Shop
  • Contact Us
  • What we do.
  • How we do it.
  • Why it works.
  • Who we are.
  • What you’ll need.
  • Let’s get started.
  • Blog
  • My account

Feb 22 2023

2023: New Home, New Goals, New Services, New Discussions

New Home: Sacramento, California, USA!

New OBC Headquarters
New OBC Headquarters – complete with Wild Turkey!

Hey everyone, I can’t believe that I’ve landed and set up shop in our new home here in Sacramento, California. Honestly, I haven’t been a Californian since 1974, so this is definitely going to be a new experience.

Online Bike Coach has been a stalwart pillar of coaching and information since its’ inception in 2003. I’ve been coaching cyclists since 1993, so this is my 30th Anniversary as a Cycling Coach! While we’ve learned, taught, and experienced many things, it’s time to reset the foundations and make the NEXT 15 years even stronger.

New Goals

New OBC Logo White PCThe Goals for Online Bike Coach going forward are simple: Offering cycling-based training classes and programs for fitness, health, longevity and performance. To do this, I am going to migrate what was a successful 15 years of In-Studio training, over to online Group Classes, via www.vqvelocity.com. Online Bike Coach will offer LIVE and RECORDED classes, multiple days of the week, with different goals and agendas. We’ll work on the FUNDAMENTALS; Aerobic Fitness, Anaerobic Work Capacity, Stamina, Strength, and Speed. You can take as many classes as you wish, pop in here and there for a quickie, or replay any one of the rides in the library as it grows. Classes will be held in the Pacific Time Zone, but I’ll be posting hours that fit client needs across the four major time zones in the US, and will consider time zones in Europe and Australia as well if there is demand.

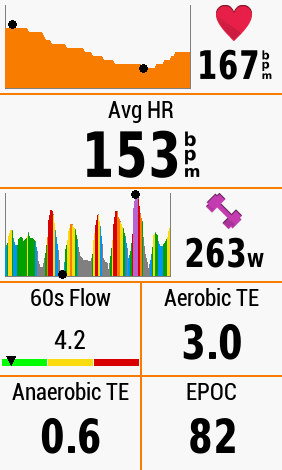
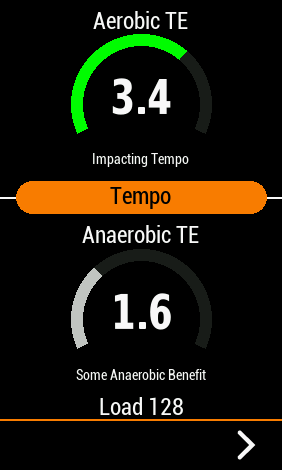
Traditional Coaching will also continue, but I’ll be increasing the hybrid approach of using the most recent cardio-vascular technology and assessment information via Garmin head units and wristwatches for Aerobic Conditioning. For those who subscribe to the ‘Polarized Training’ approach (and I use both Polarized and SweetSpot methods, depending on each rider’s needs or time availability), the latest ‘Stamina‘ Feature from Garmin, and other metrics for supra-threshold and vo2 that I’ve reviewed and used before.

We want time-tested, scientifically validated metrics, but I still fear that most producers are not interested in advancing known science, but are instead focused on profit. I refuse to be a Tent Preacher, and will emphasize known, published science where I can. Where I cannot, I’ll do the scientific studies using my own instruments, and will publish the results here and elsewhere if I can.

New Discussions

The New Discussions are not necessarily new, but they’re worth a refresh in this blog, on YouTube, and in the general public domain. I intend to blog regularly about the following:

New Hand Signals

  • Cyclist Safety. Cycling is a safe sport. Reat that ad infinitum. CYCLING IS A SAFE SPORT. There are ways you can ride and present yourself in urban and rural settings that will increase your safety, confidence, and competence when out on the road. There’s also technology that can improve your awareness and visibility. Beyond a few one-and-done videos, I intend to produce blogs and videos that show long-term work on these concepts, products and methods. For me, it’s the only way to save the sport from being an indoor-only, virtual-ride product.
  • Training With Technology. I’ve always been a fan of Science and Technology, and cycling is the perfect meld of physics, physiology, and electronic tools of observation and analysis. But there seems to be an information overload, a plethora of features, and not much explanation or distillation of the information provided. I intend to change that, with more regular posts.
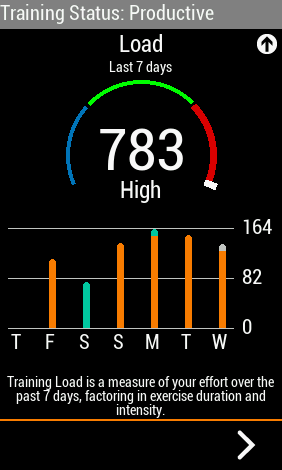
  • Garmin Connect Features. Garmin Connect is the data-collection site for so many of the metrics I have mentioned above. However, I’ve searched high and low on the internet to try and find a coach who actually uses these metrics on a regular basis, to COACH an athlete. I also see the semi-artificial intelligence programs found in Garmin Connect, and I wonder about their effectiveness. Some posts on Reddit have been all I’ve seen. The results seem to be all over the place. It makes me wonder if there might not be a better way to look at the metrics provided, and then use that information to better judge and guide fitness training. We’ll see.

I have been coaching now for thirty years; a lot has changed. A lot has not. One historian of cycling said that in the history of humanity, cycling is arguably the only activity that EVOLVED into Recreation, then Utility. It spawned the Tire Industry (Dunlop), which further altered civilization. I think we need to reconnect the social benefits of cycling with 21st century mobility and mental health.

https://youtu.be/ZYwhvD2-fYw

CONCLUSION

The Cycling world has gone ‘U’ shaped; we’ve got people in a really poor demographic using bicycles for utility, and we’ve got really rich people using bicycles for recreation. The Middle Class and cycling have largely disappeared. For example, how many of you readers rode your bikes to school? How many of you have children that ride their bikes to school? How many of you have grandchildren that ride their bikes to school? It’s a vexing question, and I’d like to look into the perceived problems and factual solutions.

That’s really about it for now. I’m going to get on with the day, and I’ll start posting more work, more regularly, going forward. I know I’ve promised that before, but I have the venue, the time, and the desire to pursue this.

Thanks for reading, and ENJOY THE RIDE.

Share this:

  • Click to share on Facebook (Opens in new window) Facebook
  • Click to share on X (Opens in new window) X

Written by Richard Wharton · Categorized: Garmin Connect, news, Uncategorized · Tagged: bicycle coach, Bike Coach, Cycling Coach, Garmin connect, Wattage Training

Sep 12 2022

ShockWiz Consistent Suggestions – Rear Suspension – 21 Rides

ShockWiz is Consistently Telling Me to “Soften Up!”

ShockWiz Rear Suspension - 21 Rides
The ShockWiz Suspension Tuning System can provide solid knowledge on ways to improve the comfort, control, and performance of the suspension on your mountain bike. Click on the image to get to a short video summary. 

The ShockWiz Suspension Tuning System continues to reveal ways to help me optimize my suspension. Peavine Mountain in Reno, Nevada, is exposed and rocky. The trails are a mix of sand and exposed, boiled Andesite rock. The trails are about 2 feet wide, with LOTS of rounded rock heads, sharp rock heads, and sagebrush. It’s classic mountain bike terrain, with winding climbs and twisty descents. Good suspension is a must, and the ShockWiz will help you optimize damping, compression, and preload.

Let’s Start With the Rear Suspension

ShockWiz Rear Score 21 Rides
Over the course of 21 rides on my home terrain, the ShockWiz Suspension Scoring system Varied from 70-92 points, but settled in at 92 points on 6 of the last 7 rides.

I’ve been using two ShockWiz units, one up front and one in the rear. This blog post is about the rear suspension, because the values have been consistent since about the fourth or fifth ride.

I began using the ShockWiz to set my suspension sag. Once that was dialed in, I followed the suggestions provided by the ShockWiz app, and tweaked compression, rebound, and air pressure. Small adjustments were made. However, no matter what changes I made, ShockWiz continued to suggest that I soften up Compression. I ended up with about 30% sag on the Fox Float DPS. Rebound was pretty dialed in. But Compression suggestions were consistent. The video with the GIF shows this.

Let’s Go Visit Mike Davis at MAD RACING!

Mike Davis MAD Racing
Mike Davis at MAD Racing in Reno, Nevada is my go-to for suspension tuning and service.

Mike Davis at MAD RACING in Reno, is my Suspension Specialist. I trust him to make internal changes to the rear shock. My bike is now at the shop, and when it returns, I’ll immediately perform a ShockWiz recalibration. THEN, I’ll head out to Peavine for more rides, and data collection. I’ve asked him to help me get sag back up to about 25%, and to make Compression softer by about 15%. He’ll use a combination of oil weight, air pressure, and valving. I can’t wait to try it out!

On Another Note….

Peavine Peak Recovery Benches
Peavine Peak is covered in trails for hikers, runners, bikers, and equestrians. Having this mountain in my back yard has been a true blessing. Here I am with my wife and my Brother From Another Mother, Jeremy, our first week in Reno in 2019.

It looks like my time in Reno is temporarily coming to an end. Our family will be relocating to Pueblo, Colorado, by the end of the month. We do intend to return to Northern Nevada at some point. However, Southern Colorado has plenty of mountain, road, and gravel opportunities and I’m excited about learning to read the terrain some place new.

Thanks for reading, and ENJOY THE RIDE!

Did you enjoy this article? Please feel free to buy me a Cup of Coffee!

Share this:

  • Click to share on Facebook (Opens in new window) Facebook
  • Click to share on X (Opens in new window) X

Written by Richard Wharton · Categorized: Mountain Biking, ShockWiz · Tagged: mountain bike coach, mountain biking, Peavine, Reno Mountain Biking, ShockWiz

Aug 24 2022

12 Rides With ShockWiz Front and Rear – An Update

The ShockWiz Continues to Provide Great Insight For Proper Suspension Setup

ShockWiz Front Rear 12 Rides
Rides on the new bike have yielded improvements in time and performance, especially when descending. The ShockWiz is helping me set up air pressure, compression and rebound damping, as well as sag. It really is making a difference in my Competence, Confidence, and Cornering Capabilities.

The ShockWiz Front and Rear Suspension Tuning devices continue to provide me with great information as I learn more about my bike and its’ performance capabilities. I set the phone up on my handlebars, and change the settings on the phone so I can see the ShockWiz app the entire time. I always review the previous day’s ride score and suggestions. So far, I haven’t made too many changes to the air pressure. However, I continue to adjust the compression and rebound settings, based on those suggestions.

The Limits of a Cross-Country Rear Shock

On my old bike, a 2012 Trek Superfly 100, I eventually replaced the rear shock with a Fox DXP2. The DXP2 had a Nitrogen chamber and was infinitely adjustable. Going with the Fox Float DPS has left me with fewer options. For example; While the ShockWiz app continually recommends softening the dampening, on the Fox Float, there are just 3 settings for this. On rebound, there are a larger number of clicks, but they don’t seem to be showing much of a difference.

After 12 rides, the ShockWiz app suggests that I make the rear suspension SOFTER on Compression, and SLOWER on Rebound. The Compression is as soft as I can get with this setup. I’ll tweak Rebound a bit more, Suggested rebound is 8 Clicks, but I’m already at 5 clicks, and I’ll now go to 4. This will increase Damping on Rebound even more, so we’ll see what that does.

Shockwiz niper T Rear Suggestions 6 Rides
This is a GIF of the most recent 6 Rides on the rear suspension. The ShockWiz consistently suggests Softening up Compression, and I’ve done what I can with the dials as they exist right now.

I’m certain that I’ll need to do some revalving under the experienced eye of Mike Davis at MAD Racing in Reno, NV.

Front Fork Improvements via ShockWiz

The Front Fork has really impressed me. It’s a 34mm Fox Fit4, with 120mm of travel. The first 3 rides revealed a low score of 74 points. The suggestions were all over the place. But after about ride 5, the Fork began to break in and show improved scores.

The most consistent suggestion that the ShockWiz reveals is to slow down Rebound. About every third ride, if the suggestions are consistent, I will rotate the Rebound knob 1-Click Clockwise to increase and slow down Rebound. The scores continue to improve, and honestly, my descending times on this one segment continue to decline as a result.

The ShockWiz App DOES suggest that I soften up Compression as well, but that feature is as light and open as it can be right now. I have ordered 10cc volume spacers for the front fork, and I will blog about those over the next few weeks. On my previous bike, I purchased a 32mm, 120mm travel Fox Fork, and the addition of Spacers yielded multiple 96-100 point rides! I definitely felt the difference!

Shockwiz Sniper T Front Suggestions 6 Rides
On the front fork, ShockWiz consistently suggests that I SLOW DOWN (“+”) my Rebound settings. I’m doing this one click every 2-3 rides.

Optimizing Suspension Makes for More Confidence, Competence, and Cornering!

It does NOT turn me into an aerial specialist – I’m too old and too scared. That said – the ShockWiz devices and app with data collection is helping me make tuning decisions that I would otherwise be unable to make, given my status as a novice in the world of MODERN mountain biking. I started racing in 1993 with a RockShox Mag21, and I can only dream of what type of performance we would have enjoyed had we had these devices way back then.

Thanks for reading and use this hardware and app to ENJOY THE RIDE!


Share this:

  • Click to share on Facebook (Opens in new window) Facebook
  • Click to share on X (Opens in new window) X

Written by Richard Wharton · Categorized: Mountain Biking, ShockWiz · Tagged: Intense Sniper T Pro, mountain biking, Peavine, Reno Mountain Biking, ShockWiz

Aug 22 2022

Garmin EPOC, Aerobic Training Effect, and Anaerobic Training Effect

EPOC, Aerobic TE and Anaerobic TE Are Great Fields to Help Measure Fitness

Aerobic TE, Anaerobic TE ,and EPOC
Sometimes it’s more fun to just ride, and get general ideas about fitness.

I’ve been using Garmin products since the early 2000’s. I love their adaptability, and their thorough approach to displays. Riders and runners love to complain about Garmin setup and use, but no other product is as complete or has so many features. EPOC is a cost-effective way to measure fitness and the results of a ride.

On July 1st, 2020, Garmin announced that they had purchased FirstBeat Technologies. This REALLY excited me, because I have studied FirstBeat since at least 2003. FirstBeat is a Finnish Company that has studied Heart Rate Variability (HRV), and how that applies to fitness. I’m currently working on HRV software through www.fitnesshrv.com, but that product is mostly designed around indoor use. For Cyclists, Runners and Swimmers who own Garmin head units and watches, we can use FirstBeat technology to gain insights into just how a ride is improving your fitness.

EPOC (Excess Post-Exercise Oxygen Consumption)

I first began studying EPOC in the mid 2000’s, when it was incorporated into the Suunto T6 fitness watch. I LOVED helping people in SPIN classes, who did not have access to wattage at the time, work on improving their fitness with this device. PUBLISHED SCIENCE shows that EPOC can help exercisers measure their efforts smarter. The TL:DR goes like this:

  • When you exercise, you stress the body.
  • The Frequency, Intensity, and Duration of the Stress (FIT) affects your heart, heart rate, and heart rate variability.
  • This stress leads to EPOC.
  • Garmin’s Training Load value serves as a “Score” for EPOC.
  • This Score can be used to modulate training. The Score also breaks down into Aerobic Training Effect and Anaerobic Training Effect.

Here’s a great link to a video that can further explain what’s going on.

EPOC Scores Lead to Aerobic TE and Anaerobic TE

In my zeal to measure all things PHYSICAL, I migrated from EPOC and Training Effect over the years, to wattage. But recently, I’ve been mountain biking a lot more, and I’m using EPOC with every ride. One of the most important aspects of all endurance exercise is finding the right balance between Aerobic Training Effect, Anaerobic Training Effect, and overall Volume. We don’t want to do too much, too often, but we do want to Progress and Periodize with the seasons.

FirstBeat defines Training Effect like this:

Training Effect (TE) represents the degree of homeostasis disturbance resulting from a session of physical activity. The Training Effect is based principally on EPOC values during exercise, which is further scaled based on the individuals fitness or activity level. The higher the TE-value the higher is also the expected increase in maximal performance after the exercise. EPOC (and TE) gets higher when either exercise intensity or duration is increased.

Training Effect describes the effect of exercise on a 0-5 scale:

0.0 – 0.9 = no effect
1.0 – 1.9 = minor effect (recovery training)
2.0 – 2.9 = maintaining effect
3.0 – 3.9 = improving effect
4.0 – 4.9 = highly improving effect
5.0 = temporarily overreaching effect

It is important to remember that a high TE is not needed in every exercise – for example doing an fitness-improving exercise session (TE e.g. 3.0) at least once a week combined with two weekly maintaining exercise sessions (TE e.g. 2.0) is enough to maintain (in trained individuals) or even improve (in sedentary individuals) the person’s aerobic fitness.

Every ride and every run will yield not just an EPOC value, but also an AEROBIC Training Effect, and an ANAEROBIC Training Effect. If you’re a mountain biker, wattage tends to be incredibly stochastic, and can be hard to interpret. Instead, if you follow my lead and add those fields to a profile page on your Garmin head unit or watch, you can observe and measure Training Effect instead!

EPOC becomes Training Load in Garmin Connect

If you own a Garmin Fitness device, you probably have a Garmin Connect account. Garmin Connect is FULL of great information! However, getting to the areas where you can assess fitness and start to understand how your training is affecting your performance, can be a little hard to find.

Try this:

  • Enter your username and password into Garmin Connect and go to the main page. It should look something like this:
Garmin Connect Dashboard Page - Hard to find EPOC in here...
The Garmin Connect Dashboard Page can be a little confusing. Lots of good information, but crowded and hard to find exactly what you’re looking for. Hard to find EPOC in here…
  • Now move your mouse to the area on the left titled “REPORTS”.

Click on “Cycling”, and “Training Status”. That SHOULD bring you to a page that looks something like this:

Garmin Reports Training Status Page
Garmin’s Training Status Page. This page will help you better understand just what your EPOC, Aerobic TE, and Anaerobic TE are doing for your fitness.
  • Let’s start at the “STATUS” area of Yellow, Orange, and Green blocks. Mousing over the blocks shows you whether the day’s work was ‘Productive’ (Green), ‘Unproductive’ (Orange), or ‘Maintaining’ (Yellow). Purple is ‘Peaking’, and black means you’re in a state of ‘Detraining’.
  • The next graph shows ‘Vo2 max’. Now, this is important. This is an ESTIMATION of Vo2. It is NOT ALWAYS all that accurate. I’ve had it be SPOT-ON, and I’ve had it be off by as much as 5 points. I’m not going to argue the merits of the claim here, but the important thing to focus on is whether that value is IMPROVING or not, and if not, why. Here’s a video link showing a man and a woman performing Vo2 max tests in a lab, and comparing those values to the Garmin Firstbeat data. The important thing to remember is that the Vo2max values are a FEATURE that comes from EPOC and Training Effect.

Next, let’s look at Exercise Load.

Garmin Exercise Load Graph
Garmin Exercise Load defaults to blue, but when you mouse over it, you get EPOC, as well as a colored breakdown of Training Effect.

Now, look at the colors, as well as the scale for this chart. It’s revealing our DAILY EPOC value from rides, as well as the Training Effect Breakdown. Most of my recent rides have been aerobic in nature, as I regain some fitness after a haywire heart concern that affected my ability to recover and sleep. If you look about five rides back from the right, you’ll see a bar that is both Orange and Purple. That was a High Intensity day, with an EPOC near 130. This is what the summary looked like on the Garmin head unit, after the ride.

Garmin Head Unit Post-Ride Aerobic and Anaerobic Training Effect Summary
The harder the terrain, the more power you need to generate. The more power you generate, the more Anaerobic the benefit. EPOC at 128 breaks down based on HRV data, to a 3.4 Aerobic TE (impacting aerobic Tempo), and 1.6 Anaerobic TE, which yielded a bit of improvement on those switchback climbs.

Finally, and perhaps most importantly, take a look at the graph on the page that shows 7-day Training Load.

Garmin Connect 7-day Training Load
The 7-Day Training Load shows the Accumulated EPOC for an individual. The black dots are the mathematical sum, the Green band is a form of Artificial Intelligence that provides a SUGGESTED EPOC value, as it relates to your recent, empirical, and goal history.

When you’re cycling through a post-ride summary, the Training Load value looks like this on your Garmin head unit.

Garmin Connect 7-day Training Load shows accumulated EPOC
The Garmin head or watch unit can provide a general sense of training status productivity. Right now, my status is “High”, because I’m intentionally overreaching on my chronic fitness, to get to a point where I can start considering HiiT intervals again, which should raise my Vo2max, as well as my Anaerobic Training Effect. EPOC for the last 7 days reads 783.

Training Effect and EPOC recommendations

The Published Science on FirstBeat’s claims shows that the values can guide users to greater gains, without further investments in expensive products. Let’s face it – these products are never cheap, and there’s always a push for more hardware integration. We can achieve this with Garmin’s NIRS technology, as well as their chest straps. The accuracy may not be as precise as a watt-meter, but it may not always be necessary to measure every Newton-Meter or KiloJoule, etc.

In general terms, try this:

  1. BE CONSISTENT. Ride, run, or swim for an EPOC of between 100 and 150 points. Use those numbers for a few weeks, and then compare them to the SUGGESTIONS on the Garmin Connect 7-day Training Load chart.
  2. VARY your Aerobic Training Effect and Anaerobic Training Effect. There ARE SUGGESTIONS for these values as well. There’s a hidden page that can show your Load Focus as it compares to the ‘Optimal Range’ Recommendations. I have been riding between a 3.0 and a 4.0 on the Aerobic Training Effect, and a 0 to 2.0 on the Anaerobic Training Effect. That will change with my fitness and my needs, but it follows my own acronym of ‘SMART’ (Specific, Measurable, Achievable, Repeatable, and Timely). It also allows me to study my Mountain Bike suspension instead of my fitness. Maybe some day I’ll even be able to merge the two, though it’s probably too late for that this year

Here’s how to get to the LOAD FOCUS OPTIMAL RANGE PAGE.

  • In the ‘Reports’ page, scroll to the top and look for ‘TRAINING STATUS’. Below that, you’ll find a row of information. Look for ‘LOAD FOCUS’. Click on the BLUE SCRIPT, and you’ll get something that looks like this:
    Garmin Reports Training Status Load Focus Area
    On the “Reports” page, scroll to the top, find ‘Load Focus’, and click on the Blue Text. Mine currently says “Above Targets”, but yours may say something different, depending on fitness, frequency, and goals.


  • You’ll end up with a page that looks like this:
    Load Focus 7-Day Graphic Values vs Optimal Values
    Notice that the OPTIMAL RANGE recommendations are within the dotted line. The values show the EPOC points for each zone over 7 days, and when you mouse over the QUESTION MARK, you get an explanation of just what those values achieve in terms of Cardio-Vascular fitness.


EPOC 100-150, Aerobic TE of 3-4, and Anaerobic TE between 0.5 and 2.0

Try it for about six weeks and tell me what you think. I’ll investigate more intensity once I get a solid aerobic base under my legs, maybe a 7-day training load of about 1100 or more, and then see what the HiiT intervals tell me.

Like what you are reading? Support this article and more!

Share this:

  • Click to share on Facebook (Opens in new window) Facebook
  • Click to share on X (Opens in new window) X

Written by Richard Wharton · Categorized: Garmin Connect, Garmin Fields, Mountain Biking · Tagged: Aerobic Training Effect, Anaerobic Training Effect, EPOC, Garmin, Garmin connect

Aug 20 2022

Setting The Q Ring Position Based On Rotor InPower Ride Data

Rotor InPower Cranks Provide Crucial Insight

Rotor InPower OCP 1
Rotor Q Rings help make small improvements to power with every pedal stroke, but it’s on sections where terrain is steep, and traction is necessary, that they make the biggest difference.

I’ve been using Rotor products since at least 2000, when the RSX Cranks first became available. I have been a student of the original concept, and I use Q rings on all of my bikes these days. In 2012 or thereabouts, Rotor began building their own power meters. Specifically, they did it with the intention of providing data for the Optimal Chainring Position. Optimal Chainring Position, or OCP, looks at a rider’s power curve and helps determine where exactly the Q ring should be located.

Why is this important? Well, the Q ring acts like a crowbar, using something called “Moment“. This is a term in Physics. A bicycle crank at 12 o’clock has no moment. I bicycle crank at 6 o’clock has no moment. But a bicycle crank at 3 o’clock has a moment equal to the radius of the crank. In my case, that is 165mm. When the Rotor InPower software takes into account Moment plus Inertia, it allows Physics to provide an edge in the power output. For road cycling on flat terrain, I usually ride at OCP 4 or even 5. Until this week, I rode the mountain bike at OCP position 3.

What Changed

Rotor has software for their InPower and 2InPower cranks, as well as their most recent power meters, that runs as an app on a cell phone. I used this app in real time, as I rode up my favorite trail. While I had figured that OCP 3 was optimal, what I realized over the course of the climb was that the steeper the terrain, the more the Rotor software wanted me in OCP 1 or even 2! I was surprised by this revelation, but in review, it makes sense. When a cyclist is climbing, the “Moment” is still optimal at 3 o’clock. However, inertia is altered due to gravity, friction, and cadence. Placing the OCP at 1 brings that ‘Crowbar’ effect back.

I made two videos connected to this post. The first is pre-ride, when I was making my change to the crank and chainring. The second is post-ride analysis. I felt the change in torque IMMEDIATELY, and while I am not nearly as fit as I was two years ago, I am excited about the change, and hope to duplicate the lesson on my road bike in the near future.

Rotor has SCIENCE to Back Up Their Claims

While I’m not a qualified scientist, I do count myself as a certain Mad Scientist. That is, I rely on PhD’s and MD’s and DO’s to perform the studies that prove or disprove what I’ve ‘seen’ over the decades that I’ve been coaching. One of my absolute favorite scientists on Q Rings, who is also a highly skilled athlete and racer, is Dr. Christie O’Hara. Here is a short link to an article about her studies with Q Rings. She’s moved on from Rotor to other ventures in Academia, but her work stands and is seminal to the theory. The gains are small, but consistent, and in a sport where small gains are critical, Q rings in the Optimal Chainring Position can make a difference for any road or mountain bike cyclist.

Enjoy the videos and don’t hesitate to leave some feedback. I’m enjoying the process and as always, ENJOY THE RIDE!


Share this:

  • Click to share on Facebook (Opens in new window) Facebook
  • Click to share on X (Opens in new window) X

Written by Richard Wharton · Categorized: Free Content, Mountain Biking, Rotor Rings and Power Meters · Tagged: Bike Coach, Cycling Coach, mountain bike coach, Optimal Chainring Position, Q Rings, Rotor InPower, Rotor Power Meters, Rotor Q Rings

  • « Previous Page
  • 1
  • …
  • 5
  • 6
  • 7
  • 8
  • 9
  • …
  • 35
  • Next Page »

Recent Posts

  • Vo2Max and Heart Health – A Single Ride Following Dr. Paddy Barrett’s Formula
  • The OBC Dicta
  • The Physiological Perspective of Four Separate 8-Minute Intervals
  • Affirming DFAA-1 Aerobic Base With Vo2Master and Moxy
  • Rotor Q Rings Revisited – Yet Again

Archives

  • April 2025
  • January 2025
  • December 2024
  • November 2024
  • October 2024
  • August 2024
  • July 2024
  • June 2024
  • May 2024
  • December 2023
  • July 2023
  • June 2023
  • May 2023
  • April 2023
  • March 2023
  • February 2023
  • September 2022
  • August 2022
  • July 2022
  • June 2022
  • January 2022
  • December 2021
  • October 2021
  • August 2021
  • July 2021
  • June 2021
  • April 2021
  • March 2021
  • February 2021
  • January 2021
  • December 2020
  • November 2020
  • October 2020
  • September 2020
  • September 2018
  • July 2018
  • June 2018
  • May 2018
  • April 2018
  • March 2018
  • September 2017
  • August 2017
  • July 2017

Categories

  • CycleVision
  • DFAA1
  • Fitness
  • Free Content
  • Garmin Connect
  • Garmin Fields
  • Garmin Varia Radar
  • Mountain Biking
  • Moxy
  • news
  • PerfPro Training
  • restricted
  • Road Cycling
  • Rotor Rings and Power Meters
  • Runalyze
  • ShockWiz
  • Sleep
  • Uncategorized
  • Vo2 Master
  • VQ Velocity
  • Xert Training
  • Shop
  • Contact Us
  • What we do.
  • How we do it.
  • Why it works.
  • Who we are.
  • What you’ll need.
  • Let’s get started.
  • Blog
  • My account

Copyright © 2025 — Online Bike Coach • All rights reserved.

info@onlinebikecoach.com   |   (1) 214-616-9850   |     |  

  • Shop
  • Contact Us
  • What we do.
  • How we do it.
  • Why it works.
  • Who we are.
  • What you’ll need.
  • Let’s get started.
  • Blog
  • My account