Online Bike Coach

Where Cyclists and Triathletes get Faster/Stronger/Leaner/Sooner

  • Shop
  • Contact Us
  • What we do.
  • How we do it.
  • Why it works.
  • Who we are.
  • What you’ll need.
  • Let’s get started.
  • Blog
  • My account

Apr 11 2023

3 Weeks of HRV Stress Readings

HRV Stress Readings Can Help You Look at the Holistic Fitness Picture

Garmin Connect HRV Stress 4 weeks report
The Garmin Connect HRV Stress Report is one more tool in Garmin’s tool chest. I use it prior to my indoor rides, to try and determine how best to proceed with my daily rides. If I have a high reading, a low sleep score, and a strained HRV Status, well, I’m goin’ back to bed.

I’m now 3 weeks in to taking a morning HRV Stress reading, and I’ve missed just a few days so far. It’s not fun, it’s probably 3 minutes where I wish I was doing something else or warming up for a bike ride, but it IS providing that ‘+1’ metric that can tell me whether I’m achieving my results, or if there’s something else going on that may require a day off, a lower intensity ride, or maybe just work to get some real stress out of my life.

HRV Stress and Life In General

Garmin Connect HRV Stress Explanation Page 1
I THINK this measurement is looking at my Heart Rate Variability as an “RMSSD“, which means “Root Mean Square of the Successive Differences”, or, ‘How Variable is Variable’?

If you’ve been reading this blog, or you know me, well, you know I’m a pretty reactionary individual and my right-brained ADD has led me to this point in life. I had a stable existence until 2010, when I got divorced and began trying to grow my studio. I left that location in 2012, opened two locations in retail spaces in 2013, got remarried in 2014, dealt with the loss of the studios in 2015 and 2017, became homeless in 2018 (thanks, Dallas DPD), and moved to Reno, NV in 2019.

Then, in late 2022, my wife and I relocated (Temporarily) to Pueblo, Colorado.  We almost immediately realized it was a mistake, and moved all the way back, to Sacramento, California. Since we arrived, we’ve lived in 3 Airbnb’s. In December, we bought a house that is a complete lemon. It’s been a struggle, figuring out how to make a living out here. We are broke, and we are broken. We are stuck here in this valley while we try to dig our way out of a house that is more shelter than home.

Like what you are reading? Support this article and more!


That’s a LOT of STRESS.

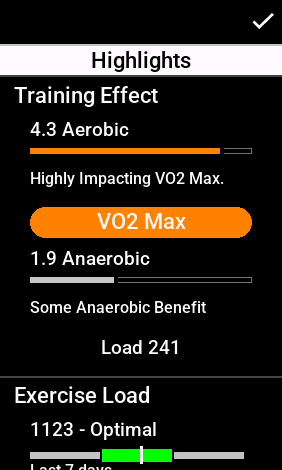
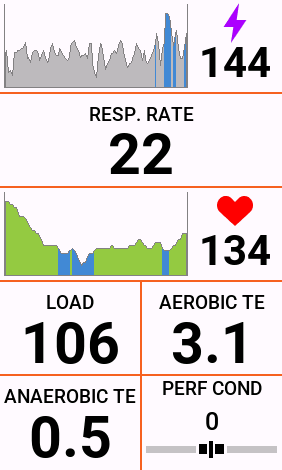
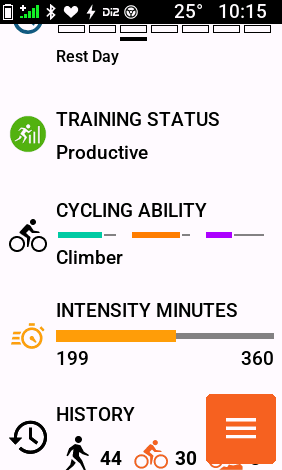
I gained weight. I lost fitness. My bikes took months to come out of storage. We suffered the worst winter in Sacramento and Tahoe area in decades. Until recently, we had literally ridden outside TWICE since December. If this isn’t a midlife crisis, I can’t imagine what a real crisis really is. That’s why I’m so interested in what the Garmin Connect Features are providing. I’m actually seeing some great results. My clients are as well. But we are all riding LESS, and riding LESS INTENTLY than before. This is anathema to my three decades of pushing watts, pushing w/kg, pushing some PHYSICAL RESULT, instead of LISTENING TO A PHYSIOLOGICAL RESPONSE.

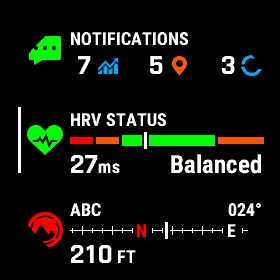
I mentioned in my previous post, that I was using HRV Status overnight to try and ensure better preparation for daily rides. This is step 2. I get up, make coffee, look at my overnight HRV Status, Glance at my Sleep Score (The Muse EEG seems to be more accurate), and then, while it’s still quiet and I’m still processing that magic first cup, I put my chest strap on, wait 30 seconds, stand up, breathe in and out for 30 seconds, then tap the ‘MEASURE’ button and watch the timer count down.
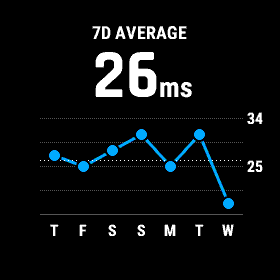
HRV Stress LEVELS

HRV Stress Explanation Page 2
This is the chart for Garmin’s HRV Stress values. I really don’t know how I’ll ever get below a 30. Maybe when I hit the lottery, or the house gets finished, or the client load is full, or….

I really ought to run a video of the recording process, but for you readers and viewers, you’d probably end up sticking a needle in your eye, out of boredom. IF I had the ability to record this information, one would see an initial low reading, then a rise, then a plateau, then maybe a fall. If I get to 64 beats per minute, I’m usually happy, but it doesn’t stay there.

Tight Band HRV Status
I usually do get called out for being an uptight, overly passionate grouch, but I really thought I was making gains in the sleep department. Maybe not.

A professional coach who knows MUCH MORE about HRV than I do, Jim Galanes, commented about my earlier post on HRV Status. He mentioned that my HRV range was both ‘Tight’ and ‘Low’, meaning high stress. My resting HR, which was once in the low 30’s, is now in the mid 50’s. I’m not sure whether this is just a product of age, or if it’s stress related, but I’d love to get six hours of sleep every night. Right now, it’s maybe 4 before a 60-90 minute awakening, and finally, a return to sleep, before waking up right at 3:58am, just before the alarm goes off.

HRV Stress – What’s Holding Me Back?

I think my parasympathetic nervous system is probably holding me back. I AM happy about the fitness gains I’ve made have been DESPITE this handicap. There is always the hope that things will improve, that income will be steady, that my wife will be happier, that the house repairs will approach completion. What’s even more frustrating is that I’ve made investments to improve these values. A better mattress… a better pillow… 96 ounces of water or more every single day…. no beer or wine. I’ve given up sugary drinks and I don’t drink caffeine after 2pm.

HRV Stress Explanation Page 3
Try doing ANYTHING for 3 minutes without distraction. It’s not easy. My mind wanders. I think about past and upcoming performances and the house.  My wife’s well-being pops up, and I drift to her family, my family, the dog. The second I get a solid week of low HRV Stress scores, I’ll make sure to write about it. Maybe that will lead to the ensuing expectation of good workouts…….

As I write this, my wife is dealing with an attempt to access healthcare. We’ve spent 90 minutes on the phone, for three days, just to find a General Practitioner. The website is out of sync with the provider’s list. There are literally no doctors available. Everything has become more complicated as we’ve aged. I haven’t even begun to investigate the DAILY STRESS that the Garmin Fenix is measuring, so maybe that’s just it – a Holistic attack on a body, from work, family, training, performance, society. There has to be a middle ground somewhere. Maybe Garmin’s HRV Stress is telling me that it’s not here, not now.

This is why the Sociopaths Keep Winning. They sleep, and sleep well, because they have no conscience.

I just want 7 hours of sleep, a healthy heart, and the fitness for some good cycling adventures with my wife.

Thanks for Reading, and ENJOY THE RIDE!

Like what you are reading? Support this article and more!


Share this:

  • Click to share on Facebook (Opens in new window) Facebook
  • Click to share on X (Opens in new window) X

Like this:

Like Loading...

Written by Richard Wharton · Categorized: Fitness, Free Content, Garmin Connect · Tagged: Bike Coach, Cycling Coach, Garmin, Garmin connect, HRV

Apr 07 2023

Garmin Connect HRV Status – Bad Night

The Garmin Connect HRV Status Predicted the Obvious – Acute Illness

Garmin HRV Overnight Crisis
Take a look at the 3 values this Garmin HRV Status Graph is showing; Empirical baseline for me is about 26-31ms. The 7-day rolling average is about 26ms. HOWEVER – It’s the THIRD metric, the OVERNIGHT AVERAGE , that led me to cancel my workout for the day. Furthermore, the increased quality and quantity of my workouts over the last week led to a lower 7-day rolling average, with coincided with an over-reach in my overall training volume.

I have been wearing a Garmin Fenix 6 Pro for at least two years. I gave up wearing a watch at some point in the late 1990’s I think. Getting a watch on my right wrist (I am left-handed) took a while to get used to again. But one of the most important features in the watch is the overnight HRV Status.

The Fenix 6 uses NIRS to measure HRV status when I am asleep. It uses this information to count the minutes I spend in DEEP, LIGHT, and REM Sleep. It also records my waking moments.

Like what you are reading? Support this article and more!


I HAVE OBSESSED OVER MY SLEEP QUALITY AND QUANTITY FOR A DECADE

I first began to notice that I was a poor sleeper in my mid 30’s. Allen Lim, a famous coach and product developer, talked in an old CyclingNews, about employing the ZEO Sleep Coach with his athletes on Grand Tours. Apparently one of the top cyclists in this current era, Tadej Pogacar, has the ability to sleep deeper, longer, than his peers, and this reflects in his ability to perform in these epic races. Mikaela Shiffrin, the record-breaking skier, apparently has the ability to sleep TEN HOURS, and NAP between runs on the course! This HAS to yield a positive effect!

I studied my sleep with that ZEO Sleep Coach until it fell apart and the company went bankrupt. More recently, I purchased a MUSE S EEG sleep tracker to replace it. I LOVE the information it gives me, but I have had a terrible time INTERPRETING THE DATA INTO USEFUL APPLICATION. In other words, I still haven’t conquered good sleep, and now that I am older, it’s hampering my performance.

FINDING AN ANSWER

One of the foremost experts in HRV Analysis is Dr. Marco Altini. He created an app that measures HRV in the morning, and comes up with a score to help determine the best approach to training that day. Honestly, he’s not a big fan of the Garmin Connect HRV Status, but I respect his contribution to the base of knowledge.

Dr. Altini QUIT DRINKING ALCOHOL.

His overnight HRV Values improved, his sleep improved, his workouts improved, and his weight improved. EVERYTHING improved.

SO…… For Lent, I (mostly) gave up drinking alcohol.

Now, I’m not going to claim to be a ’12-stepper’. I am not ‘Sober’. I just quit drinking alcohol every night, and focused on exercise and sleep.  You know what? My HRV Status improved. As it improved, my workouts improved. As the workouts improved, the weight has begun to improve. For four weeks, I have been about 95% alcohol-free, and this has led to better everything. Combine that with about 96-112 ounces of water every day, and things are starting to happen.

Until last night.

HRV Status Indicates Illness

My wife and I ate dinner out, and we combined it with drinks. I had not had a drink in about 10 days. The new restaurant, combined with the alcohol, sent my overnight HRV Status from a Baseline of 26 to 31 milliseconds between beats, down to 18 milliseconds. I slept poorly, and got sick around 1am. I was sweating in the sheets. It was a mild case of food poisoning, along with alcohol overconsumption. Now, I will discuss Garmin’s ‘Sleep Score‘ in another post, but the overnight HRV Status put me in the ‘RED’ zone, and I begrudgingly canceled my workout with my clients on VQVelocity.com, and instead, loaded up a replay.

I RARELY get sick, and I NEVER cancel workouts, live or recorded. No, I was not hung over. I was sick, dehydrated, and fatigued. The hours before a workout are critical; and I did not get quality recovery.

The Garmin Connect HRV Status recorded, and accurately warned me, to hold off on exercise, and instead, to take it easy and recover. HOURS into my day, I got a reminder on my watch that, yes, my day of recovery had led to, well, a recovery. I’ll try for a good night’s rest tonight, and should be okay for exercise tomorrow.

It’s Not The Night Before That Counts – It’s ALL the Nights Before That.

There’s an older Sports Psychology book  by Dr. Charles Garfield. There’s an interview chapter that I believe is relevant. The athlete, who was a high jumper, said, “It’s not the night before that counts, but all the nights before that.” I think Garmin’s HRV Status chart is now providing one more visualization of that. A good workout, a good series of workouts, depends on holistic consistency. It depends on a good night’s rest. It depends on weeks of good nights of rest. An athlete’s hydration needs to be optimal. I’m returning to a state of minimal alcohol intake. Not only do I want a balanced HRV status, I want a higher overnight average, that shows a true state of rest. Waking up a million times between sunset and sunrise is NOT HEALTHY OR PRODUCTIVE.

Garmin Fenix 6 Pro HRV Status
This is an image of my 7-day HRV Status from the face of my Garmin Fenix 6. It’s what I look at when I wake up around 4am most mornings.
Garmin Fenix HRV Status Bar
This is the parent menu of the previous graph, taken at a later date. “Temper Action With Wisdom”. If my HRV Status is scraping the bottom, well, I’m taking some time off. I’ll also refocus on hydration and abstinence from alcohol, just to ensure that there are no variables or outliers that may affect my recovery.

I know there are experts who will disagree with the information that the Garmin Connect ecosystem is providing. There are definitely issues with wrist-mounted or finger-mounted datapoints. But this is what I, we, you, the reader have PAID FOR with your investment in Garmin Hardware. Vicariously, it’s the information we need to observe and alter from the Garmin SOFTWARE that also matters.

I want to stay within this ecosystem long-term, and see where it leads. There’s relevant, important information being provided. I just don’t think there has been a long-term review OF that information. Let’s see where all of these data indicators lead. I myself am pretty excited!

Like what you are reading? Support this article and more!


Share this:

  • Click to share on Facebook (Opens in new window) Facebook
  • Click to share on X (Opens in new window) X

Like this:

Like Loading...

Written by Richard Wharton · Categorized: Fitness, Garmin Connect · Tagged: bicycle coach, Bike Coach, Cycling Coach, Garmin, Garmin connect, Heart Rate Variability, mountain bike coach

Mar 28 2023

Using the Garmin 1040 Post-Ride Analysis Reports

Garmin 1040 Post-Ride Analysis

The Garmin 1040 Is the Ultimate Garmin Bike Computer –

But it’s the Post-Ride Analysis That It Gives, Which Makes Such a Difference

Garmin Connect Post-Ride Analysis Training Effect
When you finish a workout, Garmin’s latest bike computers provide a detailed breakdown of Training Effect. the Garmin 1040 Post-Ride Analysis Reports start with this screen.

I’m now about 4 weeks into my return to fitness, using the Garmin Connect Ecosystem. I know that some of the metrics are controversial. That said, I’m enjoying the Garmin 1040’s Post-Ride Analysis Reports and Physiological Interpretation of the data via the head unit and Garmin Connect.

Before we go any further, if you like what you’re reading here, then:


Let’s Begin With This Chart – Courtesy of Garmin Connect

Garmin Aerobic Low and Aerobic High Definitions
This is a general description of the values achieved from different durations and intensities of work when cycling or running. I’m generally trying to keep most of my midweek rides between a 3.0 and 3.5, and keeping my EPOC between 80 and 150.

I begin most rides by looking at the following screen when cycling.

Garmin FirstBeat 1040 Metrics Page
I may have shown this before, but this is my primary Garmin screen when I ride following the Garmin Connect Ecosystem. The four boxes at the bottom help me ride with LESS intensity, and the two graphs are color-coded to help me further.

The knowledge that the first chart provides, is used by me mentally, to help “Temper ACTION with Wisdom“. In other words, we all want to get fit, fast. Getting fit, however, can’t be done quickly. It takes time. We have to think of it like a slow cooker and stew. Riding slower, longer, and with an AUTONOMIC system that responds to our stimulus. This entire exercise is about learning whether this works. I’ll write up a 28-day update soon, but by following this new information WHILE RIDING, it leads to tempered action and greater wisdom on heart health and aerobic fitness.

Ride’s Over – Now What?

When a ride ends, as long as the bike computer is linked to a phone or wifi connection, the data gets uploaded to Connect, and summaries are presented on the Garmin head unit itself.

Exercise Load Summary Garmin 1040
The horizontal bar that is first on the screen, shows a value, as well as a ‘range’ of ‘optimal’. I THINK this is based on EPOC/LOAD, and I THINK it’s based on a rolling 7-day SUM, but honestly, I don’t know, and emails to Garmin have gone unanswered.

The second area of the screen reveals my 7-day history of EPOC/LOAD, and the color-coding tells me whether it was ‘LOW Aerobic’ ‘HIGH Aerobic’ or even ‘Anaerobic’. A few of the vertical bars have a grey area. These are ‘other’ aerobic events, like hikes or dog walks.

The third area is somewhat controversial, and it’s about ‘Recovery Time‘. Recovery Time on the Garmin Connect ecosystem has largely been a frustrating thing to interpret; If a Recovery Time states that you need THREE DAYS of NO EXERCISE to recover, well, that makes training and planning to train much harder. Instead, the Garmin 1040 and now the 840 and 540, through post-ride analysis, use this time more generally. It provides a value or comment the next day, with their algorithmic sense of what might or might not be appropriate. The “Train as Usual” is that judgment by the Connect Ecosystem.

Garmin 1040 Post-Ride Analysis Page 1 – TRAINING STATUS

Garmin 1040 Training Status Summary Page
The ‘Training Status’ page is found after the ride is uploaded to Connect. It provides a quick summary of progress, along with an estimate of Vo2max, and the ‘Acute Training Load’ over the last 7 days. Green is good. Swipe Right for more information….


VO2 Max

Garmin 1040 Vo2max Summary Last 7 Days
This is the next screen, and it shows Garmin’s ESTIMATED Vo2max for each of the last 7 days. I’ve usually found this value to be pretty darned close, but then again, I have a Vo2master that I scrupulously calibrate to run my own breath-by-breath analysis. That said, I think this is accurate for my weight and for my energy output at this time.

ACUTE LOAD

Garmin 1040 Acute Load 7-Day Graph
I’m going to come right out and say it – I LOVE THIS GRAPH! I wish this graph was available on the Garmin Connect ecosystem online. Why? Well, right now, we DO NOT KNOW THE EXACT VALUES of the UPPER and LOWER areas of the GREEN RANGE. But by looking at the Acute Load, and comparing that to the graph, we can get a better understanding of what might constitute a more appropriate workout for the NEXT RIDE or RUN! Think “Bookends”.

EXERCISE LOAD

Garmin 1040 Exercise Load Last 7 Days
This is another summary of the last 7 days, showing EPOC/LOAD, and color-coding the bars to reveal the intensity of the effort. I’m trying to stay mostly blue on my base rides, I take Mondays off, and my Tuesdays and Thursdays are now dedicated to more intense rides as my fitness develops.

LOAD FOCUS

Garmin 1040 Load Focus 28-day Summary
The next swipe reveals a rolling 28-day graph of volume in different intensities. There are a couple of things that I love about this graph, but I also have my questions… First – look at the ‘ghost’ boxes. The Garmin Connect ecosystem has its’ ideas about how much time should be spent in each zone. I can’t tell if the values on the left are EPOC Points, or minutes. But this does provide a look at what the values are achieving via Heart Rate Variability in Garmin’s Ecosystem.

CYCLING ABILITY

Garmin 1040 Cycling Ability Chart
This chart is fun, but I want to see where it ends up going with me. I used to fancy myself as a “Climber” in the 1990’s when I raced mountain bikes, but when I moved to Texas, I had to basically reinvent myself as an anaerobic Breakaway Specialist or Sprinter. I am NOT a Sprinter, I’ll just tell you that. I’m really more of a Puncheur, specializing in int 30-90 second efforts at insane intensities to try and tackle terrain or peel other cyclists off my wheel and improve my odds with a Breakaway. I’m nowhere close to that righ tnow, but this summary claims I’m improving my “Climbing”. I’ll have to drive over the Sierras and return to my beloved Reno to try one of the low-traffic road climbs over there.

CYCLING ABILITY – ABILITY LEVEL ANALYSIS

Garmin 1040 Cycling Ability - Ability Level Analysis
When you press “View Analysis” from the previous image, this is what you get; a brief overview of your current status as a cyclist, and where to direct your training. It’s vague but compelling, and again, I LOVE how Garmin has “Distilled” Fitness demands from “7 Zones” or “9 Zones” or whatever series of FOCUS is popular these days, down to, “5 Minutes or less”, “20 Minutes”, and “Go Ride More”.
I’m NOT going to click on ‘View Courses’ because I don’t have enough time outdoors in this town, and I want to write a separate block on this feature entirely. So, some other time.

Garmin 1040 Post-Ride Analysis Page 2 – What Are “Intensity Minutes”?

Garmin 1040 Intensity Minutes
This feature did not exist on my Garmin 1030 at all, and I never studied it in the Garmin Connect Ecosystem. Let’s see what it offers in terms of fitness assessment.

The TL:DR about “Intensity Minutes” is that they’re a general roundup of Medical and Physiological Scientist Prognoses for maintaining and improving overall health and fitness. The Garmin 1040 Post-Ride Analysis (and Garmin Connect Ecosystem) defaults to 150 minutes of moderate effort in, and 75 minutes per week of high intensity effort in as well. This can be changed, but I haven’t really looked to find out where. I’m not sure how the Garmin calculates “Moderate” and “Intense”, but it’s probably connected to traditional heart rate zones. In this metric, High Intensity work gets counted 2x towards that overall value. Here’s what it looks like when you tap on the bar.

Garmin 1040 Weekly Intensity Minutes Goal
This is the first of 3 images dealing with ‘Intensity Minutes’. It’s showing the arc towards a goal of 360 minutes, and below that, a chart showing the daily score. There’s an explanation about this feature at the bottom.
Garmin 1040 Moderate and Vigorous Minutes
This image was snipped this morning, which was a fairly hard workout. It’s showing 47 minutes of ‘Moderate’ intensity (which I will assume is Zones 3 and 4 in Garmin terms), and 76 Minutes in Zone 5 and above.

When you meet your goal for the week, it looks like this!

Garmin 1040 Intensity Minutes Goal Met
Yea! 6 Hours moderate and intense cardio fitness! Let’s go eat some lard and re-clog our veins with peanut butter!

Garmin 1040 Post-Ride Analysis – CONCLUSION

I’m really falling in love with Garmin’s Ecosystem. I think I see the Method to their Madness. They’ve got a science-backed Heart Rate Variability Protocol with the purchase of FirstBeat. They’ve implemented the fitness features into their bike computers, watches, and scales. The Garmin Connect Reports show summaries. the On-Screen Garmin 1040 post-ride analysis gives a pretty good review of what was accomplished on the bike that day, that rolling 7-days, and the rolling 28-days. Follow the guidelines, use the EPOC, Aerobic TE, Anaerobic TE, and “Performance Condition” when riding, especially for Base, Zone 2, LSD, whatever you want to call it. I always aim for a ride between 80-150 EPOC, an Aerobic TE above 3.0, and as low an Anaerobic TE as I can get away with, indoors or out. I’ll work on the Anaerobic stuff later. I still want to see how far I can go following the Aerobic TE and EPOC.

The metrics at the end of the ride are certainly helpful. It gives me something to think about for the next day, and the next, and the next. It’s ‘Dynamic Progression and Periodization.’ It is NOT static.

Thanks for reading, and ENJOY THE RIDE!

Share this:

  • Click to share on Facebook (Opens in new window) Facebook
  • Click to share on X (Opens in new window) X

Like this:

Like Loading...

Written by Richard Wharton · Categorized: Fitness, Free Content, Garmin Connect, Garmin Fields

Mar 09 2023

Garmin Connect Fitness Metrics – 2 Weeks In

The Garmin Connect Fitness Metrics Provide More Information and Guidance

I’m now about 2 weeks in with my study of the metrics that are provided by Garmin Connect. The consistency with which I have been measuring HRV Stress in the morning, and Performance Condition during a workout, is yielding some informative results. I’ve also started to study HRV Status (an overnight reading of heart rate variability), and sleep score. I’ll report about those metrics now and in more detail in future posts.

What Goes Into My Thought Process Via Garmin Connect Data?

My thought process for the Garmin Connect interpretations is as such:

  1. Wear the Fenix 6 as much as possible, to measure HRV Status overnight, get Sleep Score, and track Hydration.
  2. Once I’ve awakened, I study the HRV Status to determine whether it is trending up, down, or within an acceptable range.
  3. Look at Sleep Score and specifically look at Deep Sleep. I need to break 52 minutes of deep sleep, and I REALLY want to get more than 6 hours of consistent sleep, but honestly, that’s a real challenge for me at this time.
  4. Take an HRV Stress test after coffee and a bathroom break. I’m sort of skipping breakfast so I can exercise mostly fasted (I use cream in my coffee).
  5. After the ride begins, if my “Performance Condition” comes out highly positive, I’ll ride for time and volume. If it’s neutral, I’ll ride for base. If it drops quickly over the first 20-30 minutes, I usually focus on LOW intensity base cycling, and try to achieve an EPOC of about 100-150 at the most right now, and then an Aerobic TE of 3.0-3.5, with no Anaerobic TE.
Garmin COnnect Training Status Reports
The Garmin Connect Training Status Report area is perhaps my favorite section of Garmin Connect. That said, I WISH I could expand these charts to get a little more detail than what it shows in this summary page.

Most of my rides have been indoors, due to weather, time commitments at the house, and a general lack of knowledge about routes and group rides in the area, since I’m new to town. This has been the wettest winter in decades, and I want to show up for any group rides prepared fitness-wise. I also want to study this stuff, so we can all use it more effectively.


The results have been pretty good so far.

Garmin Acute Training Load Chart 1040
This chart is available in the ‘Training Status’ page in Garmin Connect, but I thought I’d show it from the Garmin 1040, because, honestly, it’s sharper. It shows decent growth in volume, and it provides a general ‘Ceiling’ and ‘Floor’ of EPOC over a rolling 7-day accumulated average. At least I think that’s what it’s telling me.


My overnight HRV Status, after some initial disruptions due to outside stress factors, has largely stabilized.

Garmin HRV Status Report
When overnight HRV Status is stable or within a known range, Garmin/FirstBeat is implying that I’m okay to exercise and probably increase my volume and intensity. That’s something I would like to do, so I’ll be using the above EPOC measurement chart (see previous graph) to continue getting more overall volume, but within the limits set by Garmin Connect’s algorithm.


Garmin Connect Sleep Score 4 Weeks
The Garmin Connect Sleep Score is not my idea of the perfect measuring stick, but it is what it is, and it’s inside the Connect Ecosystem, so that’s what I’m using. I would LOVE to talk with someone about pulling the EEG data from a Muse S app, and sticking it into Connect, which is something that apparently can be done with an API or SDK. I think the EEG is more accurate.


Garmin Connect HRV Stress morning test Report
When you don’t always know where your next meal may come from, you tend to have a little higher stress some mornings. Today’s HRV Stress was at a 45, so I did a shorter, but harder workout just to get some of that stress OUT of my life! 😉


Garmin Connect Performance Condition With Heart Rate Overlay -4
This was today’s “Performance Condition” chart. It started off at a neutral value, and declined over the course of 45 minutes. The HRV Stress was in the mid-40’s, the Sleep Score was pathetic, even though my impression of my sleep quality was high.


Garmin Connect 7-Day HRV Status overnight Averages LOW
Here’s the final piece of the puzzle; my overnight average of HRV values. I THINK this is the tell-tale heart value, right here. HRV overnight was ‘low’, meaning slightly more stress, and even though in my perception, I slept well, the data just doesn’t show it. Ergo, my Performance Condition was Middlin’ at best, and then it just declined over the 45 minutes or so that I rode. Any attempt at real intensity was not to my advantage.

CONCLUSION

Looking back at several of the factors, like Sleep Score, HRV Stress, HRV Status, and the initial HRV Performance Condition value, it was evident that there was not much I could accomplish today on the bike, other than a moderate ride. Instead of attempting any intervals or even an FTP test (I keep playing with that feature on the 1040 and will accomplish it some day for a blog post), I should have gone easy.

The Garmin Connect ecosystem is teaching me, but I’m not always listening. I’ll continue to look at this guide, and share my results with you as we go along.

Thanks for reading, and ENJOY THE RIDE!


Share this:

  • Click to share on Facebook (Opens in new window) Facebook
  • Click to share on X (Opens in new window) X

Like this:

Like Loading...

Written by Richard Wharton · Categorized: Fitness, Garmin Connect · Tagged: Bike Coach, Cycling Coach, Garmin, Garmin Acute Training Load, Garmin Aerobic Training Effect, Garmin connect, Garmin EPOC, Garmin HRV Status, Garmin HRV Stress, Garmin Performance Condition, Garmin Sleep Score

Feb 28 2023

Garmin Performance Condition Metric and the Link to HRV Stress

The Performance Condition Metric is Another Indicator of Preparation for Intensity (or Easier Riding)

I’m now about 9 days into measuring my HRV Stress on the Garmin, and it definitely seems to correlate with my sleep quality, as well as my hydration values. But there is another metric that pops up a few minutes into my rides. It’s the ‘Performance Condition‘ metric, and it is also using Heart Rate Variability (HRV).

Remember – Heart Rate Variability is a way to measure the variation in milliseconds between R-Wave contractions in the heart. The more variable the values, the more rested the heart is. The more consistent the values, the more stressed the heart is. Garmin bought FirstBeat Technologies several years ago to integrate HRV technology into their entire lineup of products and services. So it’s important to understand what this stuff is telling us. This is why I’m writing these blog posts.

Garmin’s Definition of Performance Condition

Garmin’s Performance Condition Metric is pegged to their HRV algorithm. In SOME cases, they have come up with a fairly accurate assessment of an individual’s Vo2max. Vo2max is defined as: “Volume of Oxygen Uptake, measured in Liters per Minute (Absolute), or Mililliters per Kilogram per Minute (Relative). Notice that one uses weight. This value can be altered through weight loss and gain, as well as fitness conditioning. Here is their definition…

The Performance Condition metric is a real-time assessment of your ability to perform compared to your average fitness level. This metric ranges from -20 to +20 with each point representing approximately 1% of the VO2 Max set on your device. During the first 6-20 minutes of an activity the device will alert you to your current Performance Condition. This can also be used as an indicator of fatigue level, especially at the end of a long activity. Performance Condition is calculated using the following:

  • Speed
  • Heart rate
  • Heart rate variability
  • Power

Here’s an example from one of my recent rides…

Garmin Performance Condition
The Garmin Performance Condition Metric pops up at some point between 6 and 20 minutes into most of my rides, indoors and out. It uses HRV (Heart Rate Variability), wattage, and basic HR values to come up with a value between -20 and +20. It’s also related to Garmin’s estimate of your Vo2max, which in my case, is fairly accurate, though YMMV.


This Value Will CHANGE Over the Course of a RIDE

Take a look at this page I built on my Garmin 1030. There are other metrics on the page that I will write about later, but focus on the “Performance Condition” value, located in the lower right corner of the page.

Garmin Performance Condition Value Changes Over Time.
The Performance Condition Field (Lower Right) will change over the course of a ride as HRV values change. Make sure you have a good chest strap in order to ensure the best data stream to your head unit.


Here’s where this metric gets interesting, and why I think it deserves some attention.

Look at the definition above. Performance Condition looks at your Vo2max, then heart rate, heart rate variability, and wattage. Then, remember my ‘happy heart/stressed heart’ summary about HRV.

A Happy Heart beats because it wants to.

A Stressed Heart beats because it HAS TO.

If a cyclist is 30 minutes into a ride and their Performance Condition starts to drop, well, that’s a sign. If Performance Condition starts to actually CLIMB or stays STABLE, that’s another indicator.

USE THE HRV STRESS VALUE IN CONJUNCTION WITH PERFORMANCE CONDITION

My new morning routine now involves measuring HRV Stress, usually after coffee, news and email. But I also try to pay attention to my Performance Condition Value, once my ride has begun. When I ride SOLO, the Performance Condition Value can help me better understand the preparation for a ride. I’m still figuring it all out, but Clifton Duhon of NBS Nutrition has a great and relevant allegory….

“A good ride doesn’t start with a meetup in a parking lot. A good ride starts the night before the ride, with good sleep. A good ride starts with the meal that you’re having that night, so that you get to sleep better. More good rides start with better preparation via nutrition and hydration in general. Sure, we all want to talk about on-bike hydration strategies and what powders yield the most miracles. But the chronic habit of good meals, in the proper proportions, which lead to better sleep, over time, is what really matters most. Nutrition via calories and a chronic hydration and sleep plan matter more than any other ride accessory.”

If I wake up and my HRV Stress is HIGH, then I’m going to look back about 12-16 hours to determine just how I might have messed up my preparation. Did the dogs sleep on top of me? Was it too hot in the bedroom? Did I consume too much alcohol (I’m 1 week sober as I write this, as an experiment in better sleep and recovery)? What was my hydration status?

The next step on the ride is to watch for the “Performance Condition” to pop up. If THAT VALUE, combined with the HRV STRESS value, is…

  • Negative? Well, I’m rolling back into the garage.
  • If it’s POSITIVE, I’ll ride and WATCH FOR THE DECLINE in the “Performance Condition” Field to determine how and when I should return home or curtail the duration.
  • If HRV Stress is Moderate and Performance Condition is Neutral or Positive, I’ll head out and just pay attention to the Performance Condition, so see if it remains fairly flat, or if it declines quickly.
  • Sometimes, Performance Condition WILL RISE during a ride, usually when I’m riding a little more intensely. If that’s the case, I’ll work my miles and minutes, and see if it starts to decline later in the ride.
HRV Stress and Performance Condition in Garmin Connect.
In this ride, which was about an hour long, HRV Stress rose and Performance Condition Fell starting about halfway into the ride. I wanted to follow the trail of Performance Condition, but I quit when it was obvious that my body was not getting anything out of the ride that was meritorious.

CONCLUSION

I’m slowly coming full circle on the entire concept of Garmin and FirstBeat’s efforts to integrate their interpretation of Heart Rate Variability measurements and conclusions into their metrics. In the last post, I discussed HRV Stress using a 3-minute test. But this post augments that information with the Performance Condition value, and how that relates to Vo2max, and whther a ride, or any exercise, is beneficial or not. Use it to help you determine early, just how hard you might need to go. You can also use it to better strategize those days and hours prior to an event or weekend ride.

I’m still a student, and I’m going to follow this thread with myself and you. Let’s learn it together, and see what we can glean.

I will also start incorporating Garmin’s Hydration Tracker and Sleep Score, to see if we can get a more Holistic picture of fitness and preparation via the Garmin Connect Ecosystem.

Thanks for reading, and ENJOY THE RIDE.

Share this:

  • Click to share on Facebook (Opens in new window) Facebook
  • Click to share on X (Opens in new window) X

Like this:

Like Loading...

Written by Richard Wharton · Categorized: Garmin Connect, Garmin Fields · Tagged: Garmin, Garmin connect, Garmin Performance Condition, Garmin Performance Condition Feature, Performance Condition

  • « Previous Page
  • 1
  • 2
  • 3
  • 4
  • 5
  • 6
  • …
  • 9
  • Next Page »
  • Shop
  • Contact Us
  • What we do.
  • How we do it.
  • Why it works.
  • Who we are.
  • What you’ll need.
  • Let’s get started.
  • Blog
  • My account

Copyright © 2025 — Online Bike Coach • All rights reserved.

info@onlinebikecoach.com   |   (1) 214-616-9850   |     |  

  • Shop
  • Contact Us
  • What we do.
  • How we do it.
  • Why it works.
  • Who we are.
  • What you’ll need.
  • Let’s get started.
  • Blog
  • My account
%d