Online Bike Coach

Where Cyclists and Triathletes get Faster/Stronger/Leaner/Sooner

  • Shop
  • Contact Us
  • What we do.
  • How we do it.
  • Why it works.
  • Who we are.
  • What you’ll need.
  • Let’s get started.
  • Blog
  • My account

May 31 2024

Vo2Max On Garmin Connect and the Garmin 1040

Vo2Max Calculations Show Cardio-Vascular Changes

Garmin Connect Vo2Max Dial Online Bike Coach Richard Wharton
This is the Garmin Connect Vo2Max dial, located in your Garmin Connect account. It uses information from your traditional heart rate, heart rate variability, and extrinsic measurements like wattage, to glean an indirect measurement. It’s pretty accurate for me, but I’m pretty diligent in comparing it against lab-accurate devices.

Vo2max is a fitness and health measurement that is defined as, “The Maximal Volume of Oxygen that can be consumed by a person during physical exertion.” I’ve discussed Vo2max in the past, and I even own a Vo2Master assessment device, for testing and training purposes. Garmin Connect uses information collected on their head units to determine Vo2Max via a calculation. The data comes from Heart Rate Variability, traditional heart rate, time, and wattage. Testing myself over the years, the data from my Vo2master is about 98% consistent with the data from Garmin Connect. That may not be the case across a wider population, however. That said, the Garmin 1040 Vo2Max post-ride analysis graph is something I enjoy viewing, and then comparing with my own perception of a ride’s efficacy.

In short, I think the Vo2Max reading on a Garmin watch or head unit, as well as in Garmin Connect CAN provide a good and consistent value, showing improvement, stability, or detraining.

Vo2Max On Garmin Connect

Here’s my Garmin Connect Vo2Max Chart. I’m including a 1-year outlook to show seasonal variations with volume and intensity. I’m also showing a 4-week chart to refine the image a bit.

Garmin Connect Vo2Max 1-year report Online Bike Coach Richard Wharton
Vo2Max will wax and wane over time, depending on what type of cycling you’re doing, and what the seasonal demands are for volume and intensity.
Garmin Connect Vo2Max 4-week report Online Bike Coach Richard Wharton
The four-week report for this post culminated in a peak Vo2max of 60 on the week of May 13th. You’ll also notice the drop and rebound. That’s because I moved from 48m above sea level to 1584m above sea level. Vo2Max drops with altitude, and I certainly felt it!

Now – there’s a bit of a caveat here…

The Vo2Max value you see on Garmin Connect is RELATIVE.

It’s looking at:

Milliliters of Oxygen,

per Kilogram of body weight,

per minute of effort.

Let’s start with the TIME requirement. At a minimum, a rolling 60-second maximum effort is needed to get the best information. Achieving Vo2Max is REALLY FREAKING HARD. It should leave you exhausted.

Next, look at body weight. Body weight is one of the most toxic topics a cyclist or coach could ever encounter. Our culture is obsessed with weight and image, but ‘fixing’ it has been a third rail, as our society has only become MORE Diabese and LESS active over the last five decades. Furthermore, there’s the impression that ‘nothing works’. The only thing I’ll say about weight and Vo2Max is… if you want to achieve a higher level of time-limited performance, you need to SMARTLY and STEADILY increase your caloric expenditure while limiting your caloric intake, over time.

I can help, and I have clients who use a Lumen to help with dietary choices, but it’s VERY personal, and it should be a VERY private discussion. You CAN improve Vo2Max with fitness alone; it’s just that losing the weight provides that much more fitness and performance, up to a point that very, very few will ever reach. To be honest, most of us don’t need to, either.

Finally, there’s Milliliters of Oxygen Consumption. This requires a LOT of breathing. It requires that you train to expand your lungs. It requires that you train your diaphragm to suck in as much air as possible, and then utilize it in the bloodstream to the greatest degree possible.  Vo2Max training also requires that you expel as much CO2 as possible, so that the body can treat the strain and continue to operate.

Vo2Max is an indicator of POTENTIAL. It doesn’t guarantee a good ride. Still, a higher Vo2Max is a strong indicator that your fitness and wellbeing are improving from regular training, diet, nutrition, and hydration. ALL of those parameters can be recorded, measured, and interpreted inside Garmin Connect!


How Do I Improve Vo2Max?

Here’s the painful truth; Vo2Max training requires eyeball-popping intervals of high intensity, and a duration of anywhere from 30-seconds to about 6 minutes. For traditional heart rate zones, it’s intensity that elicits heart rate above Threshold, or 85-90% of Max Heart Rate. I recommend Heart Rate Reserve, because in Garmin Connect, it allows for measurement of overnight resting heart rate, and altered max heart rates over time as well.

Here’s an example of a Vo2Max workout on Garmin Connect. Feel free to click and look around. 
The science on Vo2Max training is also evolving. I’m a huge follower of Dr. Veronique Billat, but more recently, Dr. Bent Ronnestad has further studied the effect of different workouts on Vo2Max. Dr. Stephen Seiler, an expat American in Norway, has a decades-old interval set that also has been proven to improve Vo2max.

These are Published, Peer-Reviewed Professionals, who do not use conjecture to make their claims. Garmin’s Heart Rate Variability Research Arm, FirstBeat, has published their own studies in Peer-Reviewed Journals, for decades.

What the Studies Show for Vo2Max Improvements…

The studies all show that for one to improve Vo2Max, you need to spend time near… Vo2Max intensity. In the Garmin Connect world of Zones, I go with intervals in Zone 5 or even 6 (out of 7 zones) for wattage, and above 90% Heart Rate Reserve (HRR). The metabolic response starts to hurt at about 25 seconds or so, hence Billat’s 30-30’s and 60-60’s. Ronnestad tested 30-15’s to good effect. Seiler’s 4×8’s also work, but convincing an amateur athlete to attempt 4 separate 8-minute efforts at such a high intensity has often proved too much.

Now, before I give out advice on how many intervals to do and how often to do them, STOP. Don’t ask. This is why you need a coach. A coach will help with a plan for improvement, progression, periodization, and overall health. Vo2Max efforts should never be performed alone, for safety purposes. They’re highly effective, but they strain the heart and body and mind, and should be performed in a controlled, supervised environment. We do this in my VQ Velocity Virtual Studio; supervised, coached intervals with perpetual feedback about intensity, strain, stress, and training dose.

The 28-Day Vo2Max Graph On Your Head Unit or Watch

The features list on Garmin head units and watches continues to grow. There are so many features, fields, and widgets, that it’s hard to keep up. But one of my favorite post-ride features is the Garmin 1040’s Training Status pages, found in the main menu. Swipe one screen in, and you get this chart:

Garmin Connect, Head Units and Watches look at the empirical HRV data, as well as wattage, to determine Vo2Max. Acute Load is a 7-day average of EPOC, another measurement that is backed by science.

Swipe right, and this image pops up:

The Vo2Max in Garmin’s head units is, in my opinion, better than the display in Garmin Connect.

Keep swiping and more charts come up, along with general guidelines about suggested intensities and how your specific mix of intensity is categorizing you as a cyclist. I’ll blog about that later. But go back to the Vo2Max 28-day chart.

Here’s my post-ride data from March 4th of 2024 through May 31st of 2024. I did not record every day, but I did take screenshots of 58 days out of 88 days. The time block coincided with training blocks of Threshold, Vo2Max, and lately, Sprint/Anaerobic Intervals to really tax the upper limits of the Power-Duration curves of my clients and myself at the VQ Velocity Virtual Studio. I put it into a GIF so you could follow the growth pattern.


28-day growth pattern of Garmin Vo2Max
We began Threshold Training in late January, then transitioned to Vo2Max training on March 12th. Sprint Training began May 7th and will continue on the VQ Velocity Virtual Studio for another two weeks. I’ll explain the ‘Dip’ in Vo2Max in the last week next. In 88 days I raised my Vo2Max from 52 to 60ml/kg/min.

Use the Garmin Vo2Max Chart to Better Understand How Your Training Is Helping – Or Isn’t!

Remember – Vo2Max is an indicator of fitness POTENTIAL. ‘Zone 2’ training is all the rage right now, but it’s been around in scientific circles since the 1970’s. Anyone who remembers Dr. Ken Cooper and ‘Aerobics’, knows about ‘LSD’, or, Long-Steady-Distance. That’s Zone 2. It lays the groundwork for improved Vo2 in lots and lots of ways. But it’s the time spent above Functional Threshold, the time spent at or near Vo2Max, that improves fitness for the biggest bang-per-buck-per-minute.

Garmin Post-Ride Analytics yields a pretty good assessment of how a workout impacted your fitness. The Vo2Max chart, with accurate heart rate and power meter data, can provide a short history, and a future guide, to get the results you want, in a timely fashion.

Stick with it, and if you need help, write, call, or text. The #1 way to improve Vo2Max is through consistent training at any intensity.

Let’s go.

Post-Script: The DIP in my Vo2Max.

In May of this year, I made a sea-change in my life. It cost me some fitness, until my body adapts and I return stronger than ever!


So what happened? Why did I go from 60ml/kg/min down to 54ml/kg/min for a few days, before rebounding back to 58? My body weight stayed the same… So what was it?

Altitude. I moved from Sacramento, CA, back to our home in Reno, NV.

The altitude in Sacramento? 42 meters.

The altitude at my home in Nevada? 1585 meters.

The nearly 10% drop in available Oxygen required about 10 days to adapt.

There’s even a Garmin Graph for that!

Altitude Acclimation Garmin Connect
Adaptation takes time, and special attention to hydration and recovery. One Irish Whiskey can set you back 3 days (don’t ask me how I know!) 😉

After roughly two weeks of shorter breath, a lowered Threshold Power from 305 down to… 258…., I finally started rebounding, and the power is coming back up. Now, I just have to adapt to the upcoming HEAT!

Edging closer to 1585 meters….

That’s all I’ve got for now. If you liked this post, feel free to share it, and as always, click on the button below to buy me a Cup of Coffee.

 
I’ll be back with more next week! Till then,
#ENJOYTHERIDE!


Share this:

  • Click to share on Facebook (Opens in new window) Facebook
  • Click to share on X (Opens in new window) X

Like this:

Like Loading...

Written by Richard Wharton · Categorized: Fitness, Garmin Connect, Vo2 Master · Tagged: bicycle coach, Bike Coach, Garmin, Garmin connect, Reno Bike Coach, vo2master, Vo2max

Dec 14 2023

More Fun With Garmin EPOC

Garmin EPOC – A definition

Garmin Exercise Load Chart 4 Weeks
Garmin uses ‘Load’ and ‘EPOC’ synonymously. Here, in Column 4, you can see multiple ‘Load’ values, and the corresponding ‘Primary Benefit’, which is the topic of this post.

Since restarting regular training in February, I’ve come to enjoy the Garmin Connect Ecosystem and Garmin EPOC. EPOC is an acronym that stands for: “Excess Post-Exercise Oxygen Consumption”. It means this: When you exercise, you burn fat and carbs. The ratios of fat and carbs burned for fuel, depend on cardio-vascular intensities. AFTER the workout, Oxidation, or fat-burning, is important. The amount and duration of fat-burning after an exercise can be assumed via EPOC. Garmin’s EPOC is based on the work of a company called ‘FirstBeat’, which has been studying metabolics and heart rate variability since the turn of the Century and before. Most Garmin Fitness Products these days have EPOC built into the firmware.

Garmin EPOC Assesses Points for a ‘Scoring’ System

Garmin Connect Exercise Load EPOC on Mobile App
You can find the EPOC score under Garmin Connect, by looking in the ‘Stats’ section of an uploaded or synced ride. EPOC and ‘Load’ are Synonymous.

EPOC is work, measured in Kilojoules and Calories, and then scored in a points system. It’s also called ‘Load’. The score is accumulated with time and intensity. Low intensity work translates into scores rising slowly. High intensity work means the scores will rise more quickly.

‘Load Focus’ Over A Rolling 28 Days

In Garmin Connect, I began to notice that before and after workouts, the 28-day ‘Load Focus’ would change, based on daily EPOC scores, as well as the intensities. For general fitness purposes, the ‘Load Focus’ reveals EPOC points, accumulated in three different zones:

  • Low Aerobic
  • High Aerobic
  • Anaerobic

Every ride leads to gains in any of these three zones, and losses as the 28-day window ‘time’s out’. This helps people understand the benefits of consistency, and it can help them better assess their conditioning needs.

How to find ‘Load Focus’ in the Garmin Connect App.

***This is for the iPhone version of Garmin Connect. I own an Android, but have not updated it in months. If asked, I’ll append a new post with that information and directions. Thanks ***

Open your Garmin Connect App, then click on ‘•••’ on the bottom right hand corner.

Next, tap on ‘Performance Stats’.

Tap on ‘Training Status’.

And then, tap on ‘Load’.

You’ll get three horizontal bars, highlighting ‘Load Focus’ (EPOC) points at different intensities.

Load Focus and EPOC

The chart for ‘Load Focus‘ shows the accumulated, 28-day totals, for EPOC in the three zones. The zones are color-coded, and include an oval ‘Optimal Range‘. I’ll be honest. I have NO IDEA where this value comes from, or how it changes. I’ve asked Garmin for more information. I SUSPECT it’s related to the Acute Training Load, Chronic Training Load, and even Sleep Scores and Sleep Strain Scores. However, that’s pure conjecture. Still, it’s not a bad algorithm for cardio fitness!

Here’s a chart of mine from last week.

Garmin Load Focus EPOC
This was taken prior to a midweek workout. You can see that my conditioning is ‘Balanced’, and all of the EPOC 28-day summaries are within the ‘Optimal Range’ ovals.


Now, the workout consisted of multiple 75-second intervals at high intensity, with a 150-second recovery (1:2 w/r ratio), and lasted roughly an hour.

Garmin Connect Power & Heart Rate Chart Connect APP
This is what the wattage and heart rate chart are from this indoor workout.

When we look at a post I made earlier this year on Garmin’s Post-Ride Analysis Reports, EPOC dictates Aerobic and Anaerobic Training Effect. In the “Olden Days”, I would look at time spent in different heart rate zones, to make an assessment about just what a workout might have accomplished. Adding EPOC points and simplifying training zones to, “Breathing, Heaving, Gasping”, adds another degree of interpretation to the information.

Garmin Connect Heart Rate Zone Workout Results
This 60 minute workout included 26 minutes in ‘Zone 2’, just under 5 minutes in Zone 5, and over 10 minutes in Zone 4. The EPOC for this ride was 295 points.


Post-Ride EPOC Zone Placement

With a hard workout that included a lot of time in Heart Rate Zones 4 and 5, almost 25% of the entire ride, EPOC ended up at 295 points. You’ve seen the ‘Before’ chart, now, let’s compare the ‘after’ chart, and see where those ‘Load’ points went.

Garmin Load Focus EPOC
EPOC Prior to the Workout.


Post Dec 6 Garmin EPOC Load Focus Placement
Here’s the Post-Ride Garmin EPOC Load Focus.

Out of 295 Points Earned on this workout, 139 of them were added to the ‘Anaerobic’ zone. FirstBeat does not publish their algorithm, but 139 points is just under one point for every second spent in ZONE 5 of my heart rate intensity.

For the ‘High Aerobic Load’, 155 of the 295 points were placed in that zone. This was enough to skew my Load Focus from ‘Balanced’ to ‘High Aerobic’.

Notice also that ‘Low Aerobic’ did not move. It remained at 1066 points for the 28 days. This leads me to wonder if the points are not assessed position until after the workout is completed. This would make sense.

CONCLUSION – EPOC Is A Scoring System That Works With Heart Rate (and Wattage) To More Accurately Assess Fitness Improvements

I always suspected that EPOC scores directly affected Acute Training Load and Load Focus. I’ll try to assess just how Load changes the Acute Training Load in Garmin Connect in another post. For now, however, it’s just fun to see how a ride with varying intensities of heart rate and power, changes assessments in Garmin Connect. I like EPOC. It’s got the backing of Dozens of studies. The earliest I found has been 1992, and I believe FirstBeat was founded in 2002. EPOC is built into the Garmin Connect Ecosystem. As technology measuring heart rate and heart rate variability has improved, the algorithms for EPOC have also improved.

I think there’s something ‘there’, there, and my clients are enjoying the combination of heart rate, heart rate variability, and power, for a more Holistic approach to cardio fitness on bikes!

Thanks for reading, and ENJOY THE RIDE!

Did you enjoy this post? You can support me by clicking on the button below! Thanks!


Share this:

  • Click to share on Facebook (Opens in new window) Facebook
  • Click to share on X (Opens in new window) X

Like this:

Like Loading...

Written by Richard Wharton · Categorized: Fitness, Garmin Connect · Tagged: bicycle coach, Bike Coach, Cycling Coach, EPOC, Garmin, Garmin connect, Heart Rate Variability, Online Bike Coach

Apr 07 2023

Garmin Connect HRV Status – Bad Night

The Garmin Connect HRV Status Predicted the Obvious – Acute Illness

Garmin HRV Overnight Crisis
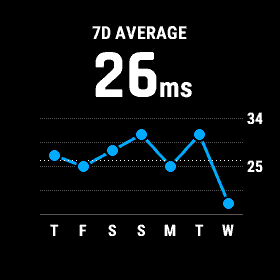
Take a look at the 3 values this Garmin HRV Status Graph is showing; Empirical baseline for me is about 26-31ms. The 7-day rolling average is about 26ms. HOWEVER – It’s the THIRD metric, the OVERNIGHT AVERAGE , that led me to cancel my workout for the day. Furthermore, the increased quality and quantity of my workouts over the last week led to a lower 7-day rolling average, with coincided with an over-reach in my overall training volume.

I have been wearing a Garmin Fenix 6 Pro for at least two years. I gave up wearing a watch at some point in the late 1990’s I think. Getting a watch on my right wrist (I am left-handed) took a while to get used to again. But one of the most important features in the watch is the overnight HRV Status.

The Fenix 6 uses NIRS to measure HRV status when I am asleep. It uses this information to count the minutes I spend in DEEP, LIGHT, and REM Sleep. It also records my waking moments.

Like what you are reading? Support this article and more!


I HAVE OBSESSED OVER MY SLEEP QUALITY AND QUANTITY FOR A DECADE

I first began to notice that I was a poor sleeper in my mid 30’s. Allen Lim, a famous coach and product developer, talked in an old CyclingNews, about employing the ZEO Sleep Coach with his athletes on Grand Tours. Apparently one of the top cyclists in this current era, Tadej Pogacar, has the ability to sleep deeper, longer, than his peers, and this reflects in his ability to perform in these epic races. Mikaela Shiffrin, the record-breaking skier, apparently has the ability to sleep TEN HOURS, and NAP between runs on the course! This HAS to yield a positive effect!

I studied my sleep with that ZEO Sleep Coach until it fell apart and the company went bankrupt. More recently, I purchased a MUSE S EEG sleep tracker to replace it. I LOVE the information it gives me, but I have had a terrible time INTERPRETING THE DATA INTO USEFUL APPLICATION. In other words, I still haven’t conquered good sleep, and now that I am older, it’s hampering my performance.

FINDING AN ANSWER

One of the foremost experts in HRV Analysis is Dr. Marco Altini. He created an app that measures HRV in the morning, and comes up with a score to help determine the best approach to training that day. Honestly, he’s not a big fan of the Garmin Connect HRV Status, but I respect his contribution to the base of knowledge.

Dr. Altini QUIT DRINKING ALCOHOL.

His overnight HRV Values improved, his sleep improved, his workouts improved, and his weight improved. EVERYTHING improved.

SO…… For Lent, I (mostly) gave up drinking alcohol.

Now, I’m not going to claim to be a ’12-stepper’. I am not ‘Sober’. I just quit drinking alcohol every night, and focused on exercise and sleep.  You know what? My HRV Status improved. As it improved, my workouts improved. As the workouts improved, the weight has begun to improve. For four weeks, I have been about 95% alcohol-free, and this has led to better everything. Combine that with about 96-112 ounces of water every day, and things are starting to happen.

Until last night.

HRV Status Indicates Illness

My wife and I ate dinner out, and we combined it with drinks. I had not had a drink in about 10 days. The new restaurant, combined with the alcohol, sent my overnight HRV Status from a Baseline of 26 to 31 milliseconds between beats, down to 18 milliseconds. I slept poorly, and got sick around 1am. I was sweating in the sheets. It was a mild case of food poisoning, along with alcohol overconsumption. Now, I will discuss Garmin’s ‘Sleep Score‘ in another post, but the overnight HRV Status put me in the ‘RED’ zone, and I begrudgingly canceled my workout with my clients on VQVelocity.com, and instead, loaded up a replay.

I RARELY get sick, and I NEVER cancel workouts, live or recorded. No, I was not hung over. I was sick, dehydrated, and fatigued. The hours before a workout are critical; and I did not get quality recovery.

The Garmin Connect HRV Status recorded, and accurately warned me, to hold off on exercise, and instead, to take it easy and recover. HOURS into my day, I got a reminder on my watch that, yes, my day of recovery had led to, well, a recovery. I’ll try for a good night’s rest tonight, and should be okay for exercise tomorrow.

It’s Not The Night Before That Counts – It’s ALL the Nights Before That.

There’s an older Sports Psychology book  by Dr. Charles Garfield. There’s an interview chapter that I believe is relevant. The athlete, who was a high jumper, said, “It’s not the night before that counts, but all the nights before that.” I think Garmin’s HRV Status chart is now providing one more visualization of that. A good workout, a good series of workouts, depends on holistic consistency. It depends on a good night’s rest. It depends on weeks of good nights of rest. An athlete’s hydration needs to be optimal. I’m returning to a state of minimal alcohol intake. Not only do I want a balanced HRV status, I want a higher overnight average, that shows a true state of rest. Waking up a million times between sunset and sunrise is NOT HEALTHY OR PRODUCTIVE.

Garmin Fenix 6 Pro HRV Status
This is an image of my 7-day HRV Status from the face of my Garmin Fenix 6. It’s what I look at when I wake up around 4am most mornings.
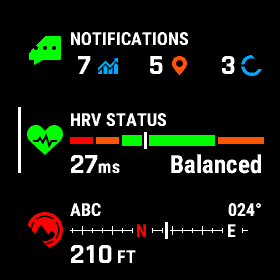
Garmin Fenix HRV Status Bar
This is the parent menu of the previous graph, taken at a later date. “Temper Action With Wisdom”. If my HRV Status is scraping the bottom, well, I’m taking some time off. I’ll also refocus on hydration and abstinence from alcohol, just to ensure that there are no variables or outliers that may affect my recovery.

I know there are experts who will disagree with the information that the Garmin Connect ecosystem is providing. There are definitely issues with wrist-mounted or finger-mounted datapoints. But this is what I, we, you, the reader have PAID FOR with your investment in Garmin Hardware. Vicariously, it’s the information we need to observe and alter from the Garmin SOFTWARE that also matters.

I want to stay within this ecosystem long-term, and see where it leads. There’s relevant, important information being provided. I just don’t think there has been a long-term review OF that information. Let’s see where all of these data indicators lead. I myself am pretty excited!

Like what you are reading? Support this article and more!


Share this:

  • Click to share on Facebook (Opens in new window) Facebook
  • Click to share on X (Opens in new window) X

Like this:

Like Loading...

Written by Richard Wharton · Categorized: Fitness, Garmin Connect · Tagged: bicycle coach, Bike Coach, Cycling Coach, Garmin, Garmin connect, Heart Rate Variability, mountain bike coach

Feb 22 2023

2023: New Home, New Goals, New Services, New Discussions

New Home: Sacramento, California, USA!

New OBC Headquarters
New OBC Headquarters – complete with Wild Turkey!

Hey everyone, I can’t believe that I’ve landed and set up shop in our new home here in Sacramento, California. Honestly, I haven’t been a Californian since 1974, so this is definitely going to be a new experience.

Online Bike Coach has been a stalwart pillar of coaching and information since its’ inception in 2003. I’ve been coaching cyclists since 1993, so this is my 30th Anniversary as a Cycling Coach! While we’ve learned, taught, and experienced many things, it’s time to reset the foundations and make the NEXT 15 years even stronger.

New Goals

New OBC Logo White PCThe Goals for Online Bike Coach going forward are simple: Offering cycling-based training classes and programs for fitness, health, longevity and performance. To do this, I am going to migrate what was a successful 15 years of In-Studio training, over to online Group Classes, via www.vqvelocity.com. Online Bike Coach will offer LIVE and RECORDED classes, multiple days of the week, with different goals and agendas. We’ll work on the FUNDAMENTALS; Aerobic Fitness, Anaerobic Work Capacity, Stamina, Strength, and Speed. You can take as many classes as you wish, pop in here and there for a quickie, or replay any one of the rides in the library as it grows. Classes will be held in the Pacific Time Zone, but I’ll be posting hours that fit client needs across the four major time zones in the US, and will consider time zones in Europe and Australia as well if there is demand.

Traditional Coaching will also continue, but I’ll be increasing the hybrid approach of using the most recent cardio-vascular technology and assessment information via Garmin head units and wristwatches for Aerobic Conditioning. For those who subscribe to the ‘Polarized Training’ approach (and I use both Polarized and SweetSpot methods, depending on each rider’s needs or time availability), the latest ‘Stamina‘ Feature from Garmin, and other metrics for supra-threshold and vo2 that I’ve reviewed and used before.

We want time-tested, scientifically validated metrics, but I still fear that most producers are not interested in advancing known science, but are instead focused on profit. I refuse to be a Tent Preacher, and will emphasize known, published science where I can. Where I cannot, I’ll do the scientific studies using my own instruments, and will publish the results here and elsewhere if I can.

New Discussions

The New Discussions are not necessarily new, but they’re worth a refresh in this blog, on YouTube, and in the general public domain. I intend to blog regularly about the following:

New Hand Signals

  • Cyclist Safety. Cycling is a safe sport. Reat that ad infinitum. CYCLING IS A SAFE SPORT. There are ways you can ride and present yourself in urban and rural settings that will increase your safety, confidence, and competence when out on the road. There’s also technology that can improve your awareness and visibility. Beyond a few one-and-done videos, I intend to produce blogs and videos that show long-term work on these concepts, products and methods. For me, it’s the only way to save the sport from being an indoor-only, virtual-ride product.
  • Training With Technology. I’ve always been a fan of Science and Technology, and cycling is the perfect meld of physics, physiology, and electronic tools of observation and analysis. But there seems to be an information overload, a plethora of features, and not much explanation or distillation of the information provided. I intend to change that, with more regular posts.
  • Garmin Connect Features. Garmin Connect is the data-collection site for so many of the metrics I have mentioned above. However, I’ve searched high and low on the internet to try and find a coach who actually uses these metrics on a regular basis, to COACH an athlete. I also see the semi-artificial intelligence programs found in Garmin Connect, and I wonder about their effectiveness. Some posts on Reddit have been all I’ve seen. The results seem to be all over the place. It makes me wonder if there might not be a better way to look at the metrics provided, and then use that information to better judge and guide fitness training. We’ll see.

I have been coaching now for thirty years; a lot has changed. A lot has not. One historian of cycling said that in the history of humanity, cycling is arguably the only activity that EVOLVED into Recreation, then Utility. It spawned the Tire Industry (Dunlop), which further altered civilization. I think we need to reconnect the social benefits of cycling with 21st century mobility and mental health.

https://youtu.be/ZYwhvD2-fYw

CONCLUSION

The Cycling world has gone ‘U’ shaped; we’ve got people in a really poor demographic using bicycles for utility, and we’ve got really rich people using bicycles for recreation. The Middle Class and cycling have largely disappeared. For example, how many of you readers rode your bikes to school? How many of you have children that ride their bikes to school? How many of you have grandchildren that ride their bikes to school? It’s a vexing question, and I’d like to look into the perceived problems and factual solutions.

That’s really about it for now. I’m going to get on with the day, and I’ll start posting more work, more regularly, going forward. I know I’ve promised that before, but I have the venue, the time, and the desire to pursue this.

Thanks for reading, and ENJOY THE RIDE.

Share this:

  • Click to share on Facebook (Opens in new window) Facebook
  • Click to share on X (Opens in new window) X

Like this:

Like Loading...

Written by Richard Wharton · Categorized: Garmin Connect, news, Uncategorized · Tagged: bicycle coach, Bike Coach, Cycling Coach, Garmin connect, Wattage Training

Jan 05 2022

SmO2 (Saturated Muscle Oxygen) From Two Locations During Billat 30-30 Intervals

This is a chart from PerfPro Analyzer 2021 (Beta). PerfPro Analyzer continues to be my favorite workout and programming tool. It has the best display, the most customizable options, and Dr. Skiba's Metrics are PUBLISHED and PEER REVIEWED. This cannot be said about other "Cycling Fitness" Platforms or their AstroTurf PhD's. Remember, "In God We Trust, All Others Bring Objective, Peer-Reviewed, Published Data With Valid Hypotheses!" Specifically, look at the two lines on this graph. The Upper Line is my SmO2 value from a Moxy Monitor placed on my Left Lateral Deltoid. The Lower Line is an SmO2 Moxy Monitor placed on my Right Vastus Lateralis. This image is from my warmup.
Become a subscriber and get access to this post and our entire coaching library, all for less than the cost of a movie ticket. Click here to learn more.

Already a subscriber? log in

Written by Richard Wharton · Categorized: Moxy, PerfPro Training, Vo2 Master · Tagged: bicycle coach, Bike Coach, Cycling Coach, Moxy, Peavine, PerfPro Studio, Reno Bike Coach, Reno Cycling, Reno Cycling Coach, SmO2, vo2master

  • 1
  • 2
  • 3
  • …
  • 5
  • Next Page »
  • Shop
  • Contact Us
  • What we do.
  • How we do it.
  • Why it works.
  • Who we are.
  • What you’ll need.
  • Let’s get started.
  • Blog
  • My account

Copyright © 2025 — Online Bike Coach • All rights reserved.

info@onlinebikecoach.com   |   (1) 214-616-9850   |     |  

  • Shop
  • Contact Us
  • What we do.
  • How we do it.
  • Why it works.
  • Who we are.
  • What you’ll need.
  • Let’s get started.
  • Blog
  • My account
%d