Online Bike Coach

Where Cyclists and Triathletes get Faster/Stronger/Leaner/Sooner

  • Shop
  • Contact Us
  • What we do.
  • How we do it.
  • Why it works.
  • Who we are.
  • What you’ll need.
  • Let’s get started.
  • Blog
  • My account

Jun 19 2023

Garmin Stamina and Stamina Potential – A Native Feature Gauging Fatigue

Garmin Stamina and Stamina Potential May Just Be the Enlightenment Tool for Cyclists and Triathletes!

Garmin Stamina and Stamina Potential Cover Graphic
Garmin Stamina is a new, Native feature that shows, in realtime as well as in post-ride analysis, how much you’ve got “Left in the Tank”, as well as the POTENTIAL for what’s “Left in the tank”! Let’s learn some more.

With the release of the ’40 Series of Garmins (the 540, 840 and 1040), as well as a host of watches, Garmin has included the Garmin Stamina and Potential feature. This native Field looks at energy use, intensity, heart rate and other elements to gauge ‘Just how much is left in the tank’ when a cyclist or runner is exercising. It’s one more tool that a cyclist, runner, or triathlete might be able to use for training, breakthroughs, or in an event.

What Is Garmin Stamina?

Garmin Stamina and Stamina Potential Screen Garmin 1040
Ride ‘Blue’, and Garmin Stamina and Stamina Potential will still decline. Fatigue happens, no matter what.

Garmin Stamina is defined as a visible metric that reveals just how much a cyclist has left, in terms of residual energy, power and work, at any capacity, over time. When a cyclist rides harder, Stamina drops faster. When the cyclist recovers, Stamina rebounds. Garmin Stamina is measured in %. If a cyclist is fresh and recovered, Stamina will start at 100%. If this is their second workout of the day, or they haven’t adequately recovered from a previous effort, it may start at <100%.

What is Garmin Stamina Potential?

Garmin Stamina and Stamina Potential Early In an Interval Set
Garmin Stamina is using a pretty complex, really proprietary, algorithm to measure fatigue and work capacity. I think it’s looking at that gool ol’ Wattage, Heart Rate (Variability), Temperature and Cadence combination. It’s pretty cool.

Garmin Stamina Potential shows just how much fatigue is affecting a cyclist’s ability to generate power. I remember Dr. Allen Lim, in 2004, telling me about requiring his athletes to use at least 600 KiloJoules of energy prior to performing intervals, because “500 watts after 600 KiloJoules is a LOT HARDER than 500 watts after just 200 KiloJoules!” And he’s right.

Garmin Stamina begins on a scale of 100-0%, and it declines with Garmin Potential as a ride progresses.

The Garmin Stamina Page On Your Garmin Head Unit

If you have a new ’40 Series, turn on the Garmin Stamina Page by following these steps:

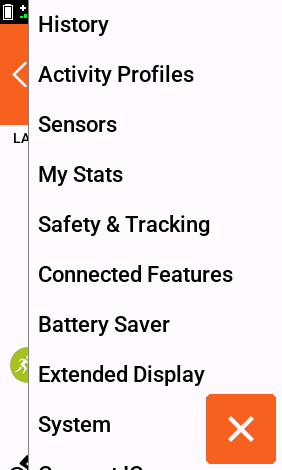
  1. On the main screen, tap on the ‘Sandwich’ Square.
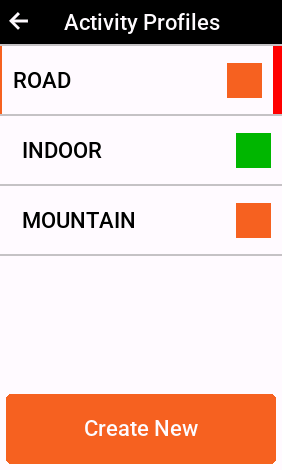
  2. Tap on ‘Activity Profiles’.
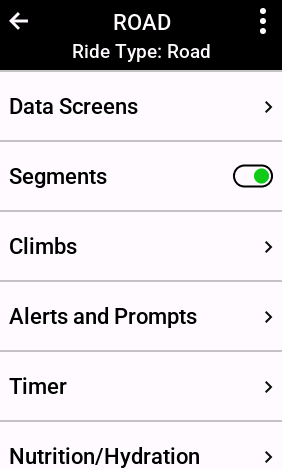
  3. Pick a Profile (I have ‘Road’, ‘Indoor’, and ‘Mountain’).
  4. Tap on ‘Data Screens’.
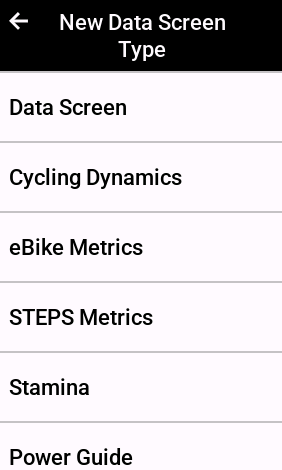
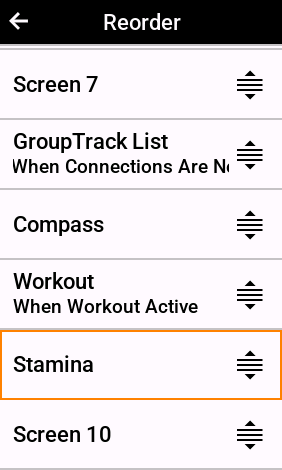
  5. Scroll up and down and look to see if ‘Stamina’ is shown as a page or not. If not, press ‘Add New’.
  6. You should find ‘Stamina’ in the options, and add it.
  7. The Garmin head unit will then offer you ways to slide the ‘Stamina’ page around in order, until it’s where you want it. As a Lefty, I tend to swipe Left-to-Right, so mine is Second-from-Last.
Garmin Stamina Page Procedure
I call the ‘Settings’ button the ‘Sandwich’ button because it looks like two slices of bread with a thin slice of ham in between!


Garmin Stamina Settings Page 2
Once you’ve clicked on the Sandwich button, you’ll see this page. Tap the ‘Activity Profiles’ button.


Garmin Stamina Page 3
Go to the Profile where you want to add a Stamina Screen.


Garmin Stamina Click on 'Data Screens'
Click on ‘Data Screens’


'Stamina' Will be near the bottom of the list.
‘Stamina’ Will be near the bottom of the list.


Garmin Stamina Reorder Option
Slide the Stamina Page around in order so you can swipe to it or in the case of the 540, you can use the buttons to slide the pages around.

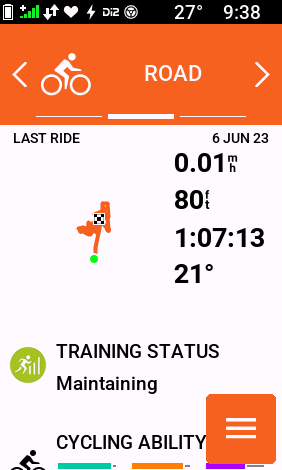
Back-Arrow out until you get to the main screen, and then tap on the Profile itself. Swipe until the screen shows up.

Garmin Stamina and Stamina Potential Page
What you end up with is a page that looks like this.

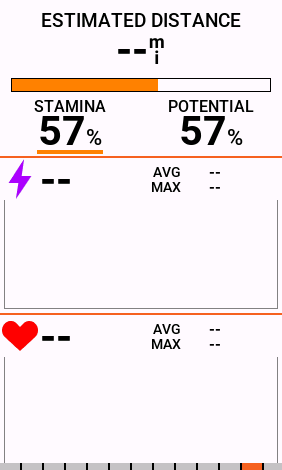
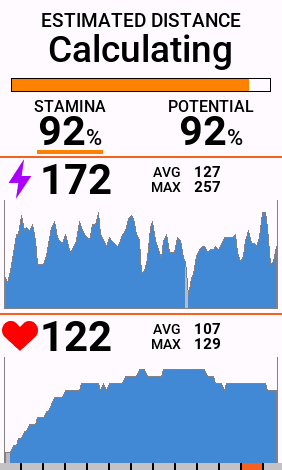
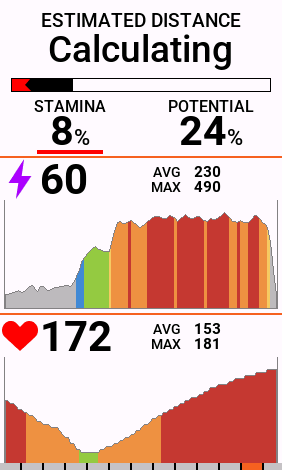
There are 3 Fields, including a Stamina Bar with Stamina and Stamina Potential in numbers, followed by a Wattage Graph, and finally, a traditional Heart Rate Graph. Above the Stamina Bar is an ‘Estimated Distance’ value, and it makes me wonder if that might not be useful for an Ultra-Cycling event. Hmmm.

How to Use Garmin Stamina and Stamina Potential

Garmin Stamina Stamina Potential 60-60s
I’m purposely avoiding revealing the wattage and heart rate values on this chart, because I honestly believe I couldn’t go any harder, or get Stamina down below 0%. These were Billat 60-60’s, and you can see that I drove the Garmin Stamina Potential down significantly as well.

Remember the ground rules:

  • Once you start a ride file, Stamina and Stamina Potential will begin to decay.
  • The rate of decay is dependent upon time spent at different intensities.
  • At low intensities, Garmin Stamina and Stamina Potential will decay at the same rate. If you ride at a higher intensity, the Garmin Stamina value will drop faster than the Garmin Stamina Potential value.
  • Garmin Stamina can rebound, but it will never be higher than Garmin Stamina Potential.
  • “500 watts after 600 KiloJoules is harder than 500 watt after 200 KiloJoules!”

A 20-Minute Effort With Stamina and Stamina Potential

I’ve been using Garmin Stamina and Stamina Potential for a couple of months now, especially in my Indoor Virtual Studio over at VQ Velocity. We recently rode some ubiquitous 2 x 20 minute efforts right at or just above Threshold. Here are the results of the first interval.

20 Minute Garmin Stamina and Stamina Potential Chart Interval 1
While I was not paying complete attention to this metric, I was watching it out of the corner of my eye.


I’ll crowd the chart a bit, to show some other physiological metrics, just so you can see how ‘hard’ this interval really was.

20 Minute Garmin Stamina and Stamina Potential Chart Interval 1 Chart 2 with SmO2
Garmin Stamina and Stamina Potential seem to be pulling from a combo of heart rate variability, wattage, and maybe respiratory rate. I added the SmO2 values from Moxy to show that I actually was at my physiological threshold, which was ABOVE the threshold value provided by Garmin (and other metric platforms, btw….). See my previous blog about SmO2 Tipping Points, and Borrowed Time.

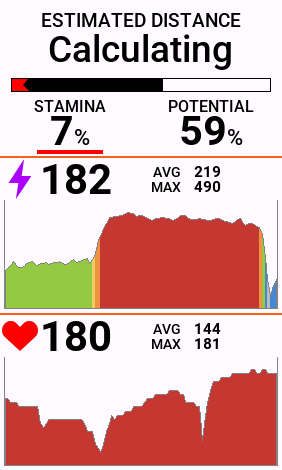
On-Screen, the Page looked like this…


Garmin Stamina Stamina Potential 20 Minute Effort
Stamina will decrease faster than Stamina Potential when you’re riding over your Threshold. Stamina Potential is a little slower, but I’m finding that it definitely helps me gauge my effort on work, especially later in a ride.

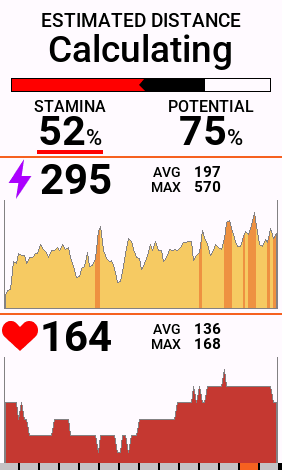
Look carefully at the Red, Black, and Clear Line. You’ll see an ‘arrow’ where the red meets the black. This is the point where the Garmin Stamina is declining faster than the Garmin Potential Stamina. Red means decline. Green means recovery. Potential will NOT recover during a ride. It may plateau, but it won’t rebound.

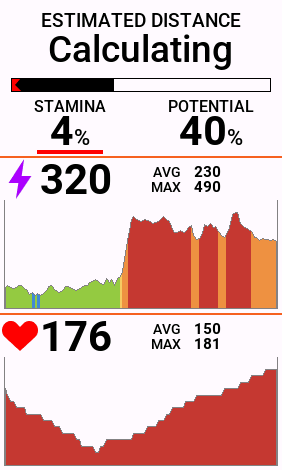
For context, here’s the graph of the SECOND 20-minute interval……

Second 20-minute Interval Garmin Stamina Stamina Potential
Physiologically, I got some training effect out of this effort, but had I followed the physics and tried to hold the same power that I had held in the first interval, I would have blown up. Stamina at 3% is an indicator that you’re ON BORROWED TIME. When Stamina and Stamina Potential are BOTH pretty low, you’re cooked, and it’s time to go home.

Billat 60-60s With Stamina and Stamina Potential.

Garmin Stamina Stamina Potential 60-60s With Comments
The 60-second interval intensity for these efforts was roughly 350-375 watts. Watching Stamina and Potential, I was able to gauge just how much I had left in the tank, before exhaustion.


Above is the post-ride overview of a set of Billat 60-second intervals with 60-second recoveries. Notice how Garmin Stamina pulls Stamina Potential down over the course of the ride.

Here’s what the ride looked like on my Garmin 1040.

Garmin Stamina and Stamina Potential Early In an Interval Set
This was Interval #7. Stamina is now in the gutter, but I still have some Potential left, so let’s keep going. 


Garmin Stamina Billat 60-60s Interval 11
11 Intervals in, and Stamina hovered between 15 and 3%. Stamina Potential dropped about 2 points per 60-second effort.


Garmin and Garmin Potential Screen 60-60 Intervals Last Effort
This was my last interval before calling it a morning. The Stamina got down to about 2% in the interval before, but I was unable to perform it for the full 60-seconds, and Stamina rebounded artificially high. While this last interval was high quality at 374 watts, Stamina only came down to 8%, while Stamina Potential reached its’ lowest level, at 24%. I was definitely fatigued.

For context, here is a link to the ride itself on Garmin Connect…


And here is an image of what Garmin gave this ride, in terms of Aerobic TE, Anaerobic TE, EPOC, and Training Effect.

Garmin Stamina Stamina Potential Workout Summary With EPOC Aerobic Anaerobic TE Scores
While I’m ignoring the ‘Tempo’ summary, this was a highly effective Aerobic and Anaerobic Workout that took days from which to recover.

Pay Attention to Garmin Stamina and Stamina Potential

Garmin has been at this game of product development now for about two decades. They bought a company (FirstBeat) with even deeper roots and history. They’re an Aviation company, a sport metrics company, and a travel logistics company. But they’re really onto something here. These developments use a history of science, a slightly conservative approach, but one that is loading features into rugged devices, and then helping recreational athletes improve their fitness in a holistic way. That’s what’s so fascinating about the Garmin Ecosystem. Their motto is, “Beat Yesterday.” And as both a coach and an athlete, using features like Garmin Stamina and Stamina Potential, I am.

Functional Threshold Power Chart Garmin Stamina and Stamina Potential
Something must be working….. The tools are all here at OBC and Garmin Connect.

I’ll post later about the possibilities of BREAKING this fatigue model, and how the model later adapts, but it’s really rare.

Thanks for reading, and ENJOY THE RIDE!

Share this:

  • Click to share on Facebook (Opens in new window) Facebook
  • Click to share on X (Opens in new window) X

Like this:

Like Loading...

Written by Richard Wharton · Categorized: Garmin Connect, Garmin Fields, Uncategorized · Tagged: Bike Coach, Cycling Coach, Garmin, Garmin connect, Garmin Cycling, Garmin Stamina, Garmin Stamina Potential

Jun 05 2023

Garmin Connect HRV Status Update

Garmin Connect HRV Status Is FINALLY Showing Some Improvement – And I’m Feeling It!

This Garmin Connect HRV based Ecosystem Is really getting interesting. I’m literally using just about everything Garmin; The Scale, the Watch, and the Head Unit. I probably ought to buy a Neo 2t and a pair of pedals, but I’m fine for now with my current setup. I know there is debate over the accuracy of NIRS, the validity of the FirstBeat HRV claims, but let’s face it; no other company is showing the commitment to data collection and general health guidelines like Garmin Fitness. It’s not cheap, but I think the long-term gains for overall health and wellness are working. The Garmin Connect HRV Status shows overnight heart rate variability, and I think the combination of regular exercise, a new bed, a more private bedroom, a LOT less alcohol at night, and a LOT more water throughout the day, is leading to better sleep, and better rides.

***Before we go any further, I’m curious to know if you think these blog posts are informational. IF you feel like they are, then .

Garmin Connect HRV Status Shows How Sleep Is Leading To Better Workouts – and Vice-Versa

Have a look at my 6-month TREND for HRV Status.

6 Month Garmin Connect Training Status Report Including HRV Status
This is the 6-Month Training Status Report from Garmin Connect. Specifically, look at the third chart; HRV Status. It shows the incredible stress I was under at the end of last year, which resulted in a severely suppressed HRV status. Once I started simply walking the dogs last winter, and we had a home we could call our own (that’s a whole other story that remains unfinished), the HRV Status began to stabilize, albeit still ‘low’ (stress) and ‘Tight’ (again, stress). Once I started training regularly again in February of this year, however, HRV Status began to stabilize, and it’s FINALLY starting to rebound, which I’ll show in the next image. Also take a look at the Garmin Connect Acute Training Load, below HRV Status. As my training load grew, HRV Status actually improved, and it was on the days where I rode an acute overreach that the HRV Status dipped back into ‘Unbalanced‘ Territory. We’re Tempering Action With Wisdom.

Now, here’s the corresponding 28-day trend, which is a bit of a close-up of the 6-month chart.

28 day Garmin Connect HRV Status April 26 through May 23rd 2023
The dots on this chart represent a rolling 7-day average of HRV Status, measured at night, from the time I fall asleep to the time I wake up. The grey zones represent a baseline range. I’ve been told that my range is too low (too stressful) and too tight (again, too much stress), but I’m encouraged by the STABILITY I’m seeing in this chart, and the RISING TREND as well. This means that I AM recovering better, and sleeping better to some degree. And as we know, a good night’s rest is critical to a good day’s performance.

Is it leading to better results?

Honestly, I don’t yet know. I am confident that my Threshold is improving, and I believe that my Anaerobic Work Capacity is growing. More importantly, I’ve started losing weight, and I just ‘feel’ better, all around. The first chart shows that Vo2 Max is improving, and I think I could probably break 300 watts for 20 minutes if I really tried. But I’m not ready yet to tax my system like that. I want to focus on consistency, and on learning as much from this Garmin Connect ecosystem as possible. There is SO MUCH DATA available!

Garmin Connect Body Weight 1 Year Graph
I’m convinced that a good night’s rest and improved overnight HRV Status, leads to better workouts with higher calorie counts. This leads to a more optimal weight. I’ll continue to avoid alcohol and increase my caloric expenditure, especially on weekends, to try and achieve my goal of 70kg. If I start to lose fitness because I’m too light, I’ll report that.

Garmin Connect HRV Status and Periodization

If you look at my Acute Training Load chart, you may see that the black line, which is a rolling 7-day average of TRIMPS. It’s bouncing near the bottom of the Green zone, known as the ‘Optimal Range’. This is intentional. I’m backing off on the intensity for the week, to avoid a fitness plateau and stale performance. My clients on VQ Velocity are really enjoying this hybrid approach to Physiology and Physics. 8 weeks in, and we’re set for one of our best summers of activity yet. I’ll be attempting a new 20-minute breakthrough next week, along with a new Threshold and Vo2 Max. I like to attempt these indoors, because it’s consistent. But if the HRV Status or Sleep Scores trend in the wrong direction, I’ll listen to my body, and will delay Breakthrough Efforts until I’m recovered and mentally prepared.

HRV Status Is One More Metric That Can Help With a Holistic Approach to Training, Recovery, and Fitness.

I sell these watches. I love these things. Any cyclist who owns a Garmin head unit and is half-serious, needs to be looking at this stuff. I DO think it’s accurate enough and consistent enough to be effective. I can’t wait to see just how fit I can become, with my clients as well. This is my new platform going forward. We’ll be migrating to this HRV-based ecosystem for the majority of our cycling, and then use wattage for those SUPRA-THRESHOLD efforts that require taxing the Central Governing Theory to its’ limits.

Thanks for reading, and ENJOY THE RIDE!

Share this:

  • Click to share on Facebook (Opens in new window) Facebook
  • Click to share on X (Opens in new window) X

Like this:

Like Loading...

Written by Richard Wharton · Categorized: Garmin Connect · Tagged: Bike Coach, Cycling Coach, Garmin, Garmin connect, Garmin HRV Status, HRV, HRV Status

May 31 2023

SmO2 and Base

The Moxy’s SmO2 Sensor Helps Make Base Training Even More Effective

SmO2 and Base Richard Wharton Online Bike Coach Garmin Connect Image 1
Saturated Muscle Oxygen can make Base Training even more effective. Look for a rise in SmO2 at a known low intensity. Then, gently raise the intensity to find that SmO2 ‘sweet spot’ of aerobic training.


This week on my VQ Velocity Virtual Studio, we are focusing on a week of Periodization and Taper. We are not performing hard intervals, but instead, we are focusing on easier rides. I wear my Moxy for all my rides, but most of the time, I focus on Desaturation and Resaturation. This blog post is about SmO2 and Base training. We can use the Garmin Connect Ecosystem to highlight the PHYSIOLOGICAL BENEFITS of low-intensity rides.

SmO2 and Base Oxygen Saturation Levels

SmO2 and Base Richard Wharton Online Bike Coach Garmin Connect ThB Image 2
When you first start a ride, the body just isn’t ready for the strain. With proper warmup and vasodilation, SmO2 rises, ThB declines, and you’re achieving the benefits of ‘Base’!

SmO2 (Saturated Muscle Oxygen) readings show cyclists just how much Oxygen Supply is in the muscles. When a cyclist is riding for BASE, there should be plenty of oxygen available. As a ride progresses, the body warms up, and the blood vessels dilate. This offers the muscles more available oxygen. Think of SmO2 as ‘Volts’ in a car battery. When there’s a heavy draw on the engine (Demand), the volts may drop, like when the ignition is engaged. On electric vehicles, computers monitor watts (torque), volts, and Amps. I compare Amps with Total Hemoglobin, which I’ll discuss later in this post.

SmO2 and Base Richard Wharton Online Bike Coach Garmin Connect ThB Image 4
Patented Warmup. Create just a wee bit of strain, then recover, and watch your SmO2 and ThB values climb over 20-27 minutes (~200-300 Calories).

Since 2012, when I first started using SmO2 monitors from Moxy, I’ve discovered that SmO2 reveals great information about Base Training. When you first place a Moxy monitor on the left Lateralis, you usually get a reading of about 30-60% SmO2. I call this ‘Active Resting SmO2’. As you warm up, SmO2 will definitely drop a bit. If a cyclist or runner does NOT perform my trademarked Warmup Protocol, SmO2 dilation does NOT reach its’ full potential, and in my opinion, restricts some of the benefits of visualizing this feature. But IF the cyclist DOES perform my Warmup Protocol, then SmO2 can become a highly effective, visual method of visualizing just what Base provides.

Base Training Is an Energy-Positive Ride

Watch this 30-second advertisement for Del Monte Green Beans. Specifically, watch what happens when this young lady goes on a bike ride. This is EXACTLY what a ‘Base’ Ride should provide a cyclist or a runner. It should be ‘Energy Positive’ for mental wellness and spiritual fulfillment. It’s literally the way most of our bike rides should occur. The time you spend out there performing this may depend on goals, etc., but SmO2 can provide a window into exactly what is happening when a ride like this occurs.

SmO2 and Base Lead to Greater ‘Volts’ of Available Power, While Drawing Less ‘Amps’ (ThB) for the Same Amount of Physical Output

In this graph, you can see how my post-warmup Base ride begins with roughly 52% SmO2. While power output changes very little, vasodilation occurs, and available SmO2 rises at roughly the 45:00 mark, with a small dip in power output. The Smo2 continues to rise after that, until I perform a single 1-minute standing effort to change my saddle position.

***Standing Power is INCREDIBLY INEFFICIENT.

If you watch old videos of Alberto Contador, there are times before he had a serious crash, when he would climb seated, and honestly, he was a GC or stage threat. After his crash and long recovery, his body was never the same, and he climbed standing for even longer periods of time. It was very powerful, but very costly. 

However, after that single effort, SmO2 rose further, with little change in power.

Why Did SmO2 Start to Decline at the 1-hour mark?

mO2 and Base Richard Wharton Online Bike Coach Garmin Connect ThB Image 3
This is where I wish I had some coding knowledge. I would build a Garmin app that would run a 1-minute graph of SmO2 and ThB, along with recent Ceilings and Floors, so I could better visualize each parameter and make a more informed choice about intensity and nutrition or hydration.

Right around the 1:05 timeline, SmO2 began to decline. When we use Garmin Connect to zoom in, we can see that it began with a slight rise in power output. This was further exacerbated by another minute of standing and pedaling. SmO2 dropped further. Once I sat down, SmO2 Resaturated, but then continued its’ decline back to around 50%.

Why did this happen? Well, let’s look at the OTHER data point that we get when we ride with a Moxy; ThB.

What is ThB?

ThB stands for ‘Total Hemoglobin’, and it’s based on Millimols per Deciliter of volume. It’s the total count of red blood cells in your overall system. Hemoglobin is a protein that carries Oxygen to the Muscles. It’s another window into the ‘SUPPLY and DEMAND’ side of the SmO2 Equation. The more ThB we have, the more ‘AMPS’ we have available to help provide fresh oxygen to the muscles, to help keep SmO2 high.

Right around the 1:05 mark, when my SmO2 began to decline, Total Hemoglobin, which was declining from minute 33:00 to that point, began to rise. After the final standing moment, it rose further, and rose until I quit the ride at the 1:15 mark. So, SmO2 declines and ThB rises, for the same amount of power.

Now, this is CONJECTURE, because I AM NOT A SCIENTIST. But my own speculation is that I was getting short on blood sugar. I always ride these easier rides in a fasted state. It’s a way to train my body to burn more fat over time, as long as I don’t push too hard. But there are only between 800 and 1200 calories of carbohydrate in the circulatory system at any time, and in the 30 years that I’ve been cycling, my body tends to change at roughly 1200 calories, WITH CARB SUPPLEMENTATION. Without Carb supplementation, I think it’s very feasible to ‘see’ the body switching energy systems or becoming less efficient. At this point, I had burned roughly 800 calories, and had consumed nothing more than water (and probably not enough of that). Hence, ThB rose, SmO2 declined, while power and basic heart rate remained neutral.

Use Your Moxy SmO2 And Keep It HIGH!

SmO2 and Base Richard Wharton Online Bike Coach Garmin Connect ThB Image 5
For roughly the same amount of power, my body responded with less stress. Once I used up my blood sugar (I was in a fasted state), the body began looking elsewhere for energy, and my SmO2 and ThB both changed to become less efficient, while power stayed the same.

My personal SmO2 Floors and Ceilings are as such, but your own zones may vary.

  • My Max Recovery Saturation is at 80%. I rarely get there on an active bike ride, so 70% means my Muscles are being resupplied with fresh Oxygen and are ready for another effort.
  • My Active Base Saturation is between 40 and 70%. When I ride at those SmO2 intensities (remember, harder is lower, easier is higher), my body is using energy to make energy in my  mind, and these are fruitful, fun, functional rides.
  • An SmO2 below 20%, and usually below 17% puts me on ‘BORROWED TIME’, and is my Vo2Max range of intensity. It’s also unustainable for long periods.
  • An SmO2 between 20 and 25% is a great Threshold Intensity for me, regardless of the old-school heart rate and wattage values that have traditionally yielded these zones.

If you really want to get a window into your body, SmO2 (and ThB) provide real-time value to help you optimize your ride. Once you know your numbers, you can always try to track gains in power or loss in weight over time. You can also watch ThB to see if you’re perhaps in need of some carbs, or may even be approaching a bonk.

I’m going to continue to share my observations. If you own a Moxy, let me know if you see similar phenomena. I’d love to learn more.

Thanks for reading, and ENJOY THE RIDE!

Share this:

  • Click to share on Facebook (Opens in new window) Facebook
  • Click to share on X (Opens in new window) X

Like this:

Like Loading...

Written by Richard Wharton · Categorized: Garmin Fields, Moxy · Tagged: Bike Coach, Coach Wharton, cycling, Cycling Coach, Garmin, Garmin connect, mountain bike coach, Moxy, Online Bike Coach, Richard Wharton, Saturated Muscle Oxygen, SmO2, ThB, Total Hemoglobin

May 22 2023

Using SmO2 for Threshold Intervals

SmO2 Provides Real-Time Physiological Info

Textbook SmO2 desaturation and Vo2 tipping point
Moxy SmO2 values give you an instant, physiological value for what is, and what isn’t, sustainable. It’s a noninvasive way to get accurate, autonomic data about aerobic and anaerobic tipping points.

Here is yet another example of the utility of an Smo2 sensor. This workout was performed by a client as well as myself last week. The goal of the intervals was to improve fitness at Lactate Threshold.

I may be a bit old-school, but I’ve essentially distilled cycling workouts to three simple levels of intensity; Breathing, Heaving, and Gasping.

  • Breathing workouts are easier, they’re aerobic, and they’re meant to improve Economy and Stamina. They burn mostly fat, but they’re on the easier side.
  • Heaving Workouts are harder, but they’re sustainable for up to 60 minutes. These would be ‘Speed’ or ‘Threshold’ type workouts.
  • Gasping workouts are super-hard, with high heart rates and respiratory rates, and they can’t be sustained for more than 6 or 8 minutes.

SmO2 works better than heart rate in all three of these types of efforts.

SmO2 – Saturated Muscle Oxygen

Moxy’s SmO2 sensors measure the amount of oxygen in your muscle. I tend to use it on my left quad, and sometimes on my left deltoid. When either my clients or myself uses it on the left quad, we get a great range of saturation, from 2-80%. With proper placement and use over time, we can get a really solid and consistent value for finding the highest sustainable power output, aka, “THRESHOLD”. When SmO2 drops BELOW that value, well, you’re on “Borrowed Time”.

Get SmO2 too low, and you're on Borrowed Time
Get SmO2 too low, and you’re on Borrowed Time.

Here are several GREAT examples!

THRESHOLD INTERVALS ARE ABOUT SUSTAINABILITY

Everyone knows about Heart Rate Zones. We’ve been using them, plus Wattage Zones now, for Decades. But the Heart tends to drift. Our bodies tend to act like bad oil filters; we work harder internally for the same external output over time. However, when we employ SmO2 sensors, and we know right where we are in terms of what the balance of Oxygen Supply and Demand is, well, we can get more work done. We can sustain this intensity more acutely. When we finally ‘Tip Over’ the Threshold, well, SmO2 shows that we’re on ‘Borrowed Time’.

Let’s Zoom In on these Intervals. We’ll start with an 8-Minute effort. This set of intervals was a ‘Reverse-Fibonacci’, and it was a set of 8-minute, 5-Minute, then 3-minute, 2-minute, and finally 1-minute intervals, with equal recoveries. It’s modeled after a Ronneveld Study, but I’ve been using regular Fibonacci efforts (1,1,2,3,5,8 sequence) for decades on the advice of Dr. Conrad Earnest, my mentor.

SmO2 captures Tipping Point Between Threshold and Vo2.
I included the ThB (Total Hemoglobin) on this image because it shows how the heart and lungs continued to work, harder and harder, to get oxygen to the muscles, even while the muscles were becoming less and less efficient. Craig’s ‘Tipping Point’ or ‘Threshold’ for Oxygen Supply and Demand is right at 17%. For the first half of the effort, he was riding with sustainable power. However, once he got to 17%, it dropped sharply, and he ‘Tipped’ into Vo2max territory, which is ‘BORROWED TIME’.


Next, let’s look at the 5-minute Interval.

5 Minute Interval at Threshold Using Moxy SMO2
Here it is again – wattage is fairly uniform, but ThB continues to rise, showing the strain, and right about the middle of the interval, just above the 17% Value, Smo2 starts to drop in to ‘Borrowed Time’.


Here’s the SmO2 Value for the 3-minute Effort.

3-Minute SmO2 and Thb Value Tipping Point.
For the 3-minute effort, You can see how SmO2 dives down to 16-17% early, then he literally holds it right there for the duration of the time period, until the LAST 30 SECONDS. The difference in wattage begins at the first red arrow. He shifted and pumped out more watts to finish. This led to a lowered SmO2 and near-exhaustion.
***also note: ThB for the middle part of the effort plateau’d. We don’t use THB as much as we should, but it’s another great indicator that a physiological intensity is sustainable – or not.


At 2 Minutes, and over 600 KiloJoules of Work Performed Thus Far, It’s Hard To Get Below Threshold


2 Minute Interval at Threshold Using Moxy SMO2
If this workout had been 3,2, and 1-minute intervals, we would have worked hard to get SmO2 Below that 17% value early, and to try and hold it there as long as possible. But after numerous high-quality efforts, SmO2 won’t dip, and this becomes, once again, a THRESHOLD EFFORT. Which was the goal.
The RISE in SmO2 at the vertical line occurs because he Stood, off the saddle. This changes muscle dynamics and force. He dropped from 100 to 60 rpm, and while power went up, he once again, WAS ON ‘BORROWED TIME’!


The Grand Finale; a 60-Second Effort!

1 Minute Interval at Threshold Using Moxy SMO2
For a 1-minute effort, we’re almost completely past the tipping point. I placed the vertical marker at 16% and you’ll see that the value stays BELOW that number EVEN AFTER THE EFFORT ENDS. The entire effort was performed well north of 300 watts, and this yielded a LARGE metabolic penalty. ThB continued to rise and while we can’t add another metric to the chart, Heart Rate was well above 95% of HRR.

Moxy and SmO2 are POWERFUL Tools

You all know – I have promoted wattage and power and kilojoules since FOREVER. But going forward, I’m going to be more nuanced. The body is a machine, but it’s a machine with huge variations in recovery, genetic ability, and psychological, almost psychotic abilities to suffer. Using a Moxy and SmO2 to determine the ‘Goldilocks’ intensity for Threshold Intervals gives us an ideal intensity FOR THAT DAY, FOR THAT MOMENT, FOR THAT DURATION. If you’re a Moxy owner, try to find your ‘Tipping Point‘ of desaturation, and then back off JUST ENOUGH to give it a sustainable, but powerful effort. Try it on a hill. After all – we don’t live on a Space Station.

I just did that this weekend, when I rode a couple of hills on a route that was unfamiliar. I used another feature on the Garmin, the ‘ClimbPro’ option (I’ll have to talk about that in another post), but here’s how it worked.

Richard Wharton Using Moxy when Climbing a Hill
This was a 6-minute hill, give or take, on an unfamiliar route. Average gradient was about 7%. I followed the ClimbPro until I knew that I was maybe 700 Meters from the end of the effort. Looking at the SmO2 data, I kept the Saturated Oxygen above 25%, and when I knew where the finish was, I increased the power EVER SO SLIGHTLY until it dipped down to about 20%. In this graph, you can also see the deflection point of ThB, and then the continued rise once I pushed it past the Tipping Point.
I was on Borrowed Time, but I knew where time could stop.


Get a Moxy and Use SmO2 For Accurate Training and Sustained Efforts At Power.

I know this is HIGH NERD STUFF. But it’s fascinating, and it’s useful. If you own a Moxy Monitor, use the Steve Neal Field and the lap function, and watch for your ‘Tipping Point’, indoors or out. You don’t want to be on ‘Borrowed Time’ for those longer intervals or hills!!!

Thanks for reading, and ENJOY THE RIDE!

If you like what you’ve just read, then

Share this:

  • Click to share on Facebook (Opens in new window) Facebook
  • Click to share on X (Opens in new window) X

Like this:

Like Loading...

Written by Richard Wharton · Categorized: Fitness, Garmin Connect, Garmin Fields, Moxy · Tagged: Bike Coach, Cycling Coach, Garmin, Garmin connect, Garmin Field, Intensity Tipping Point, Moxy, Saturated Muscle Oxygen, SmO2

Apr 19 2023

Steve Neal’s Moxy Field

Coach Steve Neal’s Moxy Field Is INCREDIBLY EFFECTIVE!

Steve Neal Garmin Connect IQ Field
Steve Neal is one of the most experienced cycling and endurance coaches out there. He’s also a Moxy User, and knows how to get the most out of your investment.

Steve Neal is one of the most successful and qualified coaches that I know. He and I have followed a similar path. We both owned Cycling Studios. He and I have worked together to employ features in PerfPro Studio. He is a pioneer in Diaphragm breathing protocols. But most recently, he built a Garmin Connect Field that highlights EXACTLY what we need to know in regards to Saturated Muscle Oxygen!

Saturated Muscle Oxygen (SmO2) is a metric that uses NIRS (Near Infra-Red Spectroscospy) to measure Saturated Muscle Oxygen levels and Total Hemoglobin Counts (ThB). The product that Steve Neal and I both use, the Moxy Monitor, is a lab-accurate device. Here’s how Steve and I use it in workouts.

Steve Neal Uses Moxy Monitors to measure SmO2.
The Moxy is a noninvasive, durable NIRS sensor that is tuned to transmit SmO2 and ThB data to Garmin Head Units and Watches.


When a muscle contracts, it uses oxygen in the process. Moxy Monitors basically measure “Supply” (Smo2) based on “Demand”, which is measured in watts. It’s a merge of Physiology and Physics.  Muscles and Lungs (Oxygen) are augmented with the measurement of heart rate, all of which I have been studying for decades.  However, at certain levels of intensity, and depending on the muscle group being measured, the Moxy can help identify what I call “Floors”, or “Ceilings”. A “Floor” is an SmO2 intensity that can be sustained under duress. If intensity rises, the SmO2 will decline and can predict exhaustion. If SmO2 rises, we know the cyclist is riding at different levels of aerobic (sustainable) intensity.

STEVE NEAL’S MOXY FIELD ON GARMIN CONNECT IQ

Steve’s Moxy Field helps Moxy owners optimize the Physiological Impact of EACH and EVERY INTERVAL and RECOVERY. The concept is simple. The cyclist places their Moxy Monitor on a muscle group (I prefer the Left Lateralis). They then head over to the Garmin Connect IQ Field on their mobile phone or via Garmin Express, and download this Custom Field. In the Settings Tab, the cyclist will enter the specific Moxy ANT+ or BLE code for that unit. They also enter the location where the Moxy will be placed. I’ll talk about different locations and what they can tell us in a bit. Finally, the cyclist places the Custom IQ Field on their Garmin Ride Profile.

My profile screen looks like this:

Steve Neal Moxy Lap Field Garmin Connect IQ Field 4
The Steve Neal Moxy Lap Field is on the bottom of this screen. It eliminates the ThB Field, and replaces it with Instant Smo2 %. The number on the Right is the ‘Lap’ Average SmO2. It will change colors as the average rises and falls in the context of the lap, and the available Oxygen in the blooodstream.

The Steve Neal Moxy Field is used in conjunction with the ‘Lap’ Button. It eliminates the view of Total Hemoglobin, or ThB. The Field gives a lot of information in a small package.

You get:

Steve neal Moxy Lap Field Description
As important as the Instant SmO2 value is, it’s the COLOR and VALUE of the number on the RIGHT that is so critical. This is where having a BIG, HUGE, HEAD UNIT, like the Garmin 1040, comes in so handy. If Garmin still made their Head-Up Display, I swear, I’d ask them to include custom fields like this one in their options for fields.
  • Instant SmO2
  • Lap Average SmO2
    • and based on the color of the Lap Average SmO2, you can determine whether your SmO2 is RISING, FALLING, or is STABLE.
    • Red is Falling, Black is Stable, and Blue is Rising.

USE STEVE NEAL’S MOXY FIELD DURING A WORKOUT

Now, the results can be individualized, but the general trend for a workout might go like this:

First, have a look at this blog post and video that explains how I use the Moxy to determine proper warmup and preparation for a ride.
Moxy Monitor Warmup Protocol – Online Bike Coach

Then, look at the Steve Neal Moxy Field, and when an interval of, say, 3 minutes begins, hit the ‘lap’ button. As intensity increases, Smo2 will decrease, and the Lap Average SmO2 will also decrease. However, 3 minutes can be an eternity of effort. Intensity has to be modulated in order to complete the task. Using the Steve Neal Field, I can identify an Oxygen Demand which is SUSTAINABLE, and then I can watch the AVERAGE, trend down towards that value. If I’m near the end of the interval, and I feel like I have a little more to give, I can INCREASE INTENSITY, and DECREASE available Smo2, switch to an anaerobic energy system, and basically ‘Leave With Nothing Left’. Hit the lap button at the end of the interval, and you can watch the SmO2 value RISE to Maximum Resaturation, which is also a great time to replenish any carbs or rehydrate. Over the course of several intervals, it becomes easier to identify a ‘Floor’ of Smo2, below which you’re on seriously borrowed time. Steve Neal has several Diaphragm Breathing Protocols that affect Smo2 levels and can improve both Stamina and Strength for endurance and intensity days on the bike.

Looking at Moxy Results On Garmin Connect After A Ride

I recently performed a set of intervals on my Virtual Studio at app.vqvelocity.com, with a client who also had a Moxy Monitor. I am in California; he is in Massachusetts. We were both using Steve Neal’s Moxy field, and we both had the Moxy Monitor on our Left Lateralis. The interval set was 14 minutes long, with intensities at 120% of FTP for 22 seconds, and 8 seconds of recovery at 50% of FTP. But the WATTAGE GOALS FOR THE WORKOUT CHANGE WITH THE VALUES that show up on Steve Neal’s Moxy Field. This interval effort is what I call a ‘Push’. Let me explain.

VQ Velocity 22-8 intervals 2 sets
I created this interval set because the metabolic response to a stimulus is about 25 seconds. It also takes about 8 seconds to reset the ATP in your legs when recovering. The 22-8’s have some intensity and recovery overlap, but they yield a VERY high overall normalized and actual average when properly employed. They’re actually a “Threshold” workout…

The overwhelming research on cycling reveals that the sport is overwhelmingly aerobic in its’ demands. Sure, we love to talk about intensities and intervals for brief moments here and there, but when the ride is over and uploaded, it’s our AEROBIC economy that makes such a difference. The goal of training, therefore, is four-fold; we want to improve STAMINA, STRENGTH, SPEED, and SKILL. Aerobic Power and economy is akin to Stamina, and that’s what we were focused on in this effort. But you can ‘see’ whether you’re aerobic or not, via the Steve Neal Moxy Field. A cyclist can also see when they’ve tripped over that line of Threshold, and they’re dipping into their own, personal, time-limited, “Well of Despair”! The second-by-second watts are less important here. What IS important is getting the cyclist to their own, personal, average SmO2, that is both painful, but yet also sustainable. This workout was a Threshold Workout, and the Moxy data shows just that. Aerobics is the ‘Push’ of Economy and Stamina. Anaerobic Intensities and Vo2Max efforts, are the ‘Pull’.

Garmin Connect Moxy Quad Watts Heart Rate
This is a screen report from the Garmin Connect File. Steve’s Moxy Field showed me a cumulative average and an idea of intensity that I just can’t get from traditional heart rate. If you look at the grey data points, which is SmO2, you’ll see that around minute 40, SmO2 began to rise. Why? Look at the RECOVERY WATTS in purple. I began to take those 8 second recoveries more seriously, and my Saturated Muscle Oxygen rose in accordance. ‘ON’ Power stayed high, and this allowed me to do MORE of the ‘Work’, which is beneficial.

On my first interval, I hit the ‘Lap’ button on my Garmin 1040 Solar, and rode at the varying intensities that the workout prescribed, until I hit a value of Saturation below 20%. The stochastic nature of the intervals within the set show perpetual swings of wattage, but the SmO2 drifted between 14 and 18%. For the First Interval Set, I averaged 17% for SmO2. Average power? 292 watts. This is WELL ABOVE the predicted Thresholds that have been set for me by numerous other Threshold Calculators. The second Interval? 20% SmO2 with power at a more modest 261 Watts, still above my ‘Calculated” Threshold. Traditional Heart Rates? They were 172 bpm and 168 bpm, both arguably UNDER my claimed Threshold of 173 bpm.

Steve Neal Moxy Field With SmO2 Wattage and DFAA-1
Here’s the second set. I wanted to show the SmO2 values with DFAA-1 values from AlphaHRV, which is another great Field found in Connect IQ. I use both fields, but I find that Moxy ‘Floors’ are more acute than the ‘rolling 2-minute’ value that we commonly use to calculate DFAA-1. 

Moxy Values are more accurate and precise than traditional Heart Rate and Wattage Claims for Threshold Values. They also highlight FATIGUE and arguably, DEHYDRATION or a BONK. That’s another discussion for another day, but the gist of it is this; We’ve had this tool for about 10 years now, but it required mental calculation to determine Aerobic and Anaerobic Thresholds. Now, with the Steve Neal Moxy Field, we get Instant values, Average Values, and a Trend, which is worth its’ weight in gold.

CONCLUSION

Everyone knows how much I love power meters. More recently, I’ve fallen in love with the study of Heart Rate Variability. I love how that works with our bodies in a more holistic way. With the release of Steve’s Moxy Field, we now have the tool to observe thresholds acutely, and then determine ways to dive through them, stay at or just above them, and recover from efforts more effectively.

I’ll save the next blog post for another aspect of Steve Neal’s Moxy Field, where we will look at the same workout, but from the aspect of the LEFT DELTOID. The numbers are going to be more nuanced, but they continue to reveal some INCREDIBLE, REPEATABLE, NONINVASIVE information.

Until then, ENJOY THE RIDE!


Share this:

  • Click to share on Facebook (Opens in new window) Facebook
  • Click to share on X (Opens in new window) X

Like this:

Like Loading...

Written by Richard Wharton · Categorized: Garmin Connect, Garmin Fields, Moxy · Tagged: Bike Coach, Cycling Coach, Garmin, Garmin connect, Moxy, Richard Wharton, Sacramento Cycling Coach, Saturated Muscle Oxygen, SmO2, VQ Velocity, VQVelocity

  • « Previous Page
  • 1
  • 2
  • 3
  • 4
  • 5
  • …
  • 19
  • Next Page »
  • Shop
  • Contact Us
  • What we do.
  • How we do it.
  • Why it works.
  • Who we are.
  • What you’ll need.
  • Let’s get started.
  • Blog
  • My account

Copyright © 2025 — Online Bike Coach • All rights reserved.

info@onlinebikecoach.com   |   (1) 214-616-9850   |     |  

  • Shop
  • Contact Us
  • What we do.
  • How we do it.
  • Why it works.
  • Who we are.
  • What you’ll need.
  • Let’s get started.
  • Blog
  • My account
%d