Online Bike Coach

Where Cyclists and Triathletes get Faster/Stronger/Leaner/Sooner

  • Shop
  • Contact Us
  • What we do.
  • How we do it.
  • Why it works.
  • Who we are.
  • What you’ll need.
  • Let’s get started.
  • Blog
  • My account

Aug 12 2024

Vo2Master Vo2Max Value Affirms Garmin Vo2Max Estimator

Vo2Master’s Vo2Max Value Was 98% Consistent with Garmin

Richard Wharton Vo2Master OBC Headquarters
THE THINGS I DO FOR SCIENCE!

In May of this year, I wrote a post about the Garmin Vo2Max Calculator. In July, I was able to test my Vo2Max at OBC Headquarters, to compare values. I performed a Graded Exercise Test, using the Vo2Master app. This app, on a cell phone, trapped data from multiple sources. The Vo2Master’s Vo2Max value showed a 1-point difference from the calculation to the actual results.

Let’s take a look at what I learned about myself.

Remember – Vo2 is translated into: ‘Volume of Oxygen Consumed’. It’s the rate at which Oxygen is absorbed by the body for use in muscle contraction and life-sustaining activities. The Greeks believed that breath was life… and they were right.

The Vo2Master Provides a TON of information!

Vo2Master App Metrics
This is just one page of data fields that I can use on the Vo2Master app. You can also run these fields as graphs. All of the data is stored in a detailed .csv file that can be downloaded and shared for analysis.

Since it launched over 5 years ago, the Vo2Master app continues to improve. Just about any sports fitness product that has Bluetooth transmission can now be recorded. These myriad data points can also be displayed, in numeric or graphical format. My only complaint about this has been the inability to display and record this information on a larger screen, like that found in a laboratory or on a regular PC. But that’s a side project that I’m actually working on via (fitnesshrv.com). The app can also be simulcast from a phone or tablet to a large screen with 3rd party apps or with Apple TV.

For this test, I recorded the following external data points:

  • Load Generator (Ergometer)
  • Power (crank)
  • Heart Rate (chest strap)
  • Heart Rate Variability (HRV)
  • Cadence (crank)
  • SmO2 (Moxy)

These data points allow me to transfer the information learned in from the Vo2Master, over to my body and bike when I’m cycling outdoors.

For the ‘Native’ Vo2Master data, I recorded:

  • Respiratory Frequency
  • Tidal Volume
  • Ventilatory Exhalation in Liters per Minute
  • Expired Oxygen

ALL of this information was recorded on a single .csv file, and a summary report was delivered after the test ended.

Any information that was able to be transmitted via Ant+ signal, was also recorded on my Garmin Head Unit.

Vo2Max Test Parameters

I can build just about any test protocol I wish to construct, but the most common Graded Exercise Tests for Vo2Max are built like this:

  • A decent warmup that includes instrument and ergometer calibration to ensure accuracy.
  • 2-4 minute stages at preset wattage loads.
  • A 25 to 30-watt jump (“step”) at the end of each stage.
Vo2Master Graded Exercise Test App Protocol
The Vo2Master app can perform Graded Exercise Tests, ‘5-1-5’ type tests, and even training intervals. Variations within each set are based on time and intensity.

For this test, I had already warmed up, so I just chose a 5-minute warmup, 3-minute stages, and a 30-watt jump in each step.

The Test

Vo2Master Graded Exercise Test
The area in grey is the exercise load. Purple is the power coming off of my power meter on my bike. Red is my traditional heart rate. Blue is the Vo2 data coming from the Vo2Master.

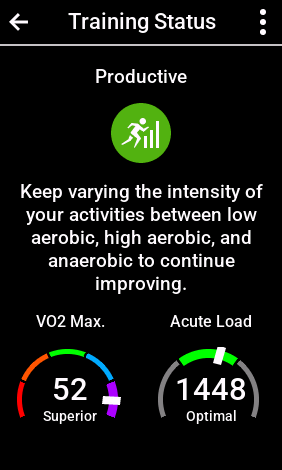
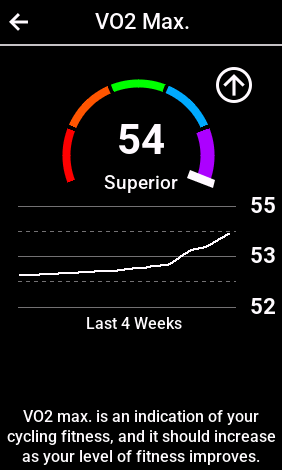
The test was performed on July 14th of 2024. The previous week, Garmin Connect had my Vo2Max calculated at 57ml/kg/min. The Primary goal was to determine the accuracy of this number. The secondary goal was to determine Ventilatory Threshold #1 (VT1) and Ventilatory Threshold #2 (VT2) to see if those wattage, heart rate, and other physiological results, were in-line with the Calculations made by Garmin Connect.

*** Remember – this is just ONE individual performing ONE Graded Exercise Test. There’s nothing linear or broad. I’ll add to this information over time, but it’s just a snapshot of my fitness, compared to a mathematical algorithm by a fitness company.

I began the test at 100 watts of resistance, which was then raised by 30 watts every 3 minutes. I ended the test at roughly 300 watts of ergometer load, when I was exhausted, and my Max Heart Rate was at a value I hadn’t seen in about 6 months.

A Few Problems with the Data

When you look at the graphs I’m providing, you’ll see that there are two problems with the data, neither of which is enough to discount the information in it, but it IS important to understand the results.

Vo2master test anomalies
I’ll perform this test again some time, using an axle or spider based power meter. I may also acquire the ‘other half’ of the power meter (the left leg – this is a rare, right-leg-only pm), and show why 2-legged pm’s are so much better.

First – there’s a glaring delta between the Ergometer Load and the Power generated. Those two values should be roughly 1:1 (Power should be roughly equal to the resistance provided, per Newton’s Third Law). The Power lagged behind the Ergometer load the entire ride, even after calibrating both devices. I believe the data from the power meter is accurate, however, and it’s the information I would use outdoors or in training. So, while it’s not in line with load, it does still provide valid data.

Second – the power line itself is variable. I blame this on the fact that I use a one-legged power meter indoors, and the data packets can ‘speed up’ or ‘fall behind’ at certain cadences. I’m fully aware of the shortcomings of one-legged powermeters, which is why, when I ride outdoors, I truly prefer axle-based powermeters, and more specifically, ‘two-legged’ power meters that trap the torque on both cranks, and use the information to compute a more accurate and thorough set of data.

For this test, the average for each step was fine, but in the future, I will make two specific changes. I’m going to purchase a more modern trainer, and I’ll purchase the ‘other leg’ of my power meter, so I can get the more accurate information for my indoor-only bike.

Vo2Max Results

The most important question I wanted to know was what the Vo2Master would show my Vo2Max to be, and what that value was in relation to the calculated estimation of Vo2Max from Garmin Connect.

Here are the results:

Vo2master Vo2max Graded Exercise Test Report Results
This is the first page of the Graded Exercise Test Report from Vo2Master. I basically blew a 56 Vo2, which lines up with the calculation that my Garmin Connect has made, at 57 just a week before.

The Vo2Master trapped my Vo2Max at 55.8 milliliters of oxygen consumed per kilogram of body weight per minute of exertion.

Garmin Connect had recorded a 57 about a week earlier. That’s 98% consistent.

I’ll Take it.

Other Fitness Data Points

If you know anything about me, you know I’m a nerd for Data. The goal for me as a Coach, however, is to help ‘distill’ this information in to practical knowledge. That’s why I focus on lower-cost alternatives and Garmin Connect, to set fitness levels, training zones, and fitness programs. Progression does require frequent re-assessment, however, which is why I like using the Vo2Master. It provides the ultimate, scientifically validated information that we can then use to reset these zones with more accuracy.

Vo2master Heart Rate Vs Wattage Graph with VT1 and VT2
The linear plot between heart rate and wattage is nice, but it’s even better when you plot VT1 and VT2 against the other two metrics. This gives you the knowledge to understand just how ‘hard’ you can ride before physiological and metabolic changes in energy consumption start to occur.

Ventilatory Threshold 1 (VT1)

Ventilatory Threshold 1 (VT1) is a point in time where the Respiratory Rate (RR) or Ventilatory Exhalation (VE) in Liters per Minute, outpaces the rise in Vo2. It is ROUGHLY analogous to Lactate Deflection Point #1, which is an invasive measurement that uses needles and blood to assess the processing of lactate as energy. When that value rises, exercise physiology changes energy use from mostly fat consumption – to fat and carbs consumption, to overwhelmingly carb use for energy. Lactate testing is invasive, adds risk, and the data collection is prone to error. As a result, I use Saturated Muscle Oxygen from a Moxy, and I also use DFAA-1, a measurement that looks at Heart Rate Variability, to assess these intensities, when I’m not wearing a Vo2Master.

Vo2master Gas Exchange FeO2 and EqO2
While I’m not discussing this chart in this blog, the information it’s providing is priceless. FeO2 is expired oxygen. If less o2 is exhaled, that means more is in the bloodstream and is helping the muscles with contraction. It shows the ‘Air’ in ‘Aerobic’ Exercise!

The Garmin Connect system, paired with Garmin bike computers and watches, uses power, heart rate, heart rate variability, respiratory rate from the chest strap, and weather information, to come up with heart rate and wattage zones. These values CHANGE with changes in volume and intensity over time, which is one more reason why I’m intrigued with what the Vo2Master has to say, in relation to the zones set by Garmin Connect.

Garmin Connect Algorithm Vs. Vo2Master Gas Exchange Results

Vo2master with Tidal Volume Ventilatory Exhalation and Respiratory Frequency
Here’s another Graph of the Vo2Master data plot. My Tidal Volume, at 3.7 liters, is actually a bit low; I need to train for deeper, slower breathing. This will delay the onset of VT1 and VT2, and thus improve my economy.

Here’s the comparison between the Vo2Master Zones, and the Garmin Zones after the test.

VT1/Zone 2 ‘Fat Burning’ Zone…

  • Vo2Master: 142 Beats Per Minute for VT1. Below that value, let’s call it ‘Zone 2’
  • Garmin Connect: 145 Beats Per Minute.
  • That’s a 2% difference.
  • VT1 Wattage Value? 183 watts
  • Zone 2 Upper Value for Garmin Connect: 179 watts.
  • That’s a 2% difference…

VT2/Functional Threshold Heart Rate and Power…

  • Vo2Master: 174 Beats per Minute. This is the ‘zone’ above which you’re on borrowed time, and below which, you can still exercise for an extended duration.
  • Garmin Connect? 172 Beats per Minute.
  • 1% delta. Again – I’ll take it.
  • Vo2Master Wattage at VT2/Threshold? 251 Watts.
  • Garmin Connect? 247 Watts.
  • A 1.5% delta. Again – for fitness purposes, I’ll take it.

Setting SmO2 Zones Based on Vo2Master Data

Once the VT1 and VT2 Values for wattage and traditional heart rate were set, I then took a look at the Saturated Muscle Oxygen information at those breakpoints.

Vo2master With SmO2 and ThB Values from a moxy monitor
I love, love, love my Moxy Monitors. They offer a noninvasive way to measure intensity on the ‘demand’ side, while heart rate provides information on the ‘supply’ side. Note the inclusion of Total Hemoglobin, or ThB. Thb declines until I reach VT1, then plateaus in my ‘tempo zone’, then begins to rise as I surpass Functional Threshold Power, or VT2.

Here’s what it showed:

  • SmO2 at VT1, where heart rate was 142 bpm and wattage was 183 watts, showed 37% saturation on my Left Lateralis. I usually use 40% saturation as my VT1/LT1/Zone2 breakpoint, so this value is in sync with my perception.
  • SmO2 at VT2, where heart rate was 174 and wattage was at 251 watts, was at 19% SmO2 Saturation. Again – I tend to use 20% saturation as the mark for my VT2/LT2/Threshold.
  • SmO2 measured by a Moxy on my Left Lateralis, showed highly correlated values with VT1 and VT2 for wattage and heart rate. That’s now three datapoints I can use when training, indoors and out, to correlate with the Gold Standard of Gas Exchange Analysis.

There are some great studies which show how SmO2 is equally valid to Lactate testing. The advantage is that SmO2 is noninvasive. I use SmO2 daily, and rely on it for optimal warmup and vasodilation, as well as for monitoring hydration and even looking at Moxy highs and lows during intervals, to gauge exhaustion more accurately. Most of you reading this already have a Garmin watch or bike computer and an advanced chest strap. Investing in a Moxy can augment your knowledge and improve upon your intuition about intensities and the duration you can ride at those levels.

Conclusion

Vo2Master GXT Zone Prescription
I usually simplify the 5 zones to just 3. Stay below 142 for base, stay above 174 for Vo2Max intensity, and work intervals above and below 251 and 183 watts (these will change with fitness).

The Vo2Master’s Vo2Max readings confirmed the calculations I am getting from Garmin Connect. Correlation between Vo2Master’s VT1 and VT2 for wattage, heart rate, and Saturated muscle oxygen, was also high.

The Vo2Master is the pinnacle of portable, accurate, physiological testing. I’ll be using it on some outdoor rides on the mountain bike to show just how hard mountain biking is, and how we can use that information to better train and prepare. Perhaps more importantly, at least in my case, the Vo2Max calculated through Garmin Connect, along with the thresholds and zones, means that I can train with higher confidence, knowing that the physiological data backs up Garmin’s claims and assumptions to a really high degree!

Thanks for reading, and #EnjoyTheRide!

Share this:

  • Click to share on Facebook (Opens in new window) Facebook
  • Click to share on X (Opens in new window) X

Like this:

Like Loading...

Written by Richard Wharton · Categorized: Fitness, Garmin Connect, Moxy, Uncategorized, Vo2 Master · Tagged: Bike Coach, Cycling Coach, cycling fitness, Garmin, Garmin connect, Moxy, Richard Wharton, vo2master, Vo2max

Jul 27 2024

Building An MTB Course With Garmin Connect Course Creator

Garmin Connect Course Creator Offers Course Building – But Singletrack Can Be A Challenge

The Garmin Connect Course Creator is yet another of Garmin’s under-utilized features. Other Apps and Software offer Course Creation, like RideWithGPS, but keeping everything inside the Garmin Connect Ecosystem allows for easier transfer to a Garmin Bike Computer or wristwatch. However, it is easier to build a course on known roads or routes. If a cyclist wants to build a Garmin Course for a mountain bike trail, he or she has to be precise, and add in a LOT of waypoints. These waypoints can be a distraction when certain settings are running on Garmin Hardware.

Let’s dig in to the Garmin Connect Course Creator.

Creating a New Course in Garmin Connect Course Creator

I’ll post a caveat to this weblog; GO TO A WEB BROWSER ON A PC OR MAC and use the ‘Big Screen’ version of Garmin Connect. 

Once you’re in Garmin Connect, move the mouse over to the vertical ‘Connect’ drop-down menu of options.

Click on ‘Training & Planning’, then on ‘Courses’. The ‘Courses’ sub-menu will pop up, and you’ll see a list of options, including ‘My Courses’, ‘Favorites’, and ‘Nearby Courses’, where you can see public routes built by other cyclists or afficionados.

I’ve highlighted the course I’m reviewing for this post; the ‘2019 Reno Wheelmen Peavine Classic XC MTB Course – Online Bike Coach Created‘.

When you mouse over the pre-built course, the route pops up on the map overlay, with a summary of distance, meters or feet of climbing, and descent. There’s also the option to ‘Send to device’, which I’ll cover later.

Garmin Connect Course Creator Map 1
Garmin Connect offers a course building feature. Here’s where to find it.

This course is my ‘home’ course, and it’s the one I use for almost all of my training and testing purposes. It’s usually low-traffic, and it can be completed in about 30 minutes for me.


Garmin Connect Routing Options

The first part of the process is to use the ‘Custom’ Drawing Method. Why? Well, sometimes maps are not completely updated; in this case, if I try to follow the ‘Follow Popular Routes’ option, the ‘Halo Trail’, shows an old, dug-up, not-used version of singletrack. This trail is not even called ‘Halo Trail’ at that junction. The trail is called ‘Total Recall’.

Garmin Connect Course Builder Image 2
Sometimes satellite images are not as up to date as maps might be. Here, when the Garmin Routing Option was set to ‘Follow popular routes’, the Purple Trail, known as ‘Halo’, was where the routemaker kept taking me. That trail has been re-routed to the trail that is more prominent (and serpentine). Changing the ‘Routing’ setting to ‘Freehand’ allows a coursemaker to follow the most updated trail for GPS purposes.

In this image, you can see that as I needed more detail, I added more and more waypoints, to stay on the route I wanted.

Garmin Connect Course Creator Waypoints lots of waypoints
To keep the Course as accurate as possible, use LOTS and LOTS of waypoints. Waypoints will create a straight line between them for the course, so add as many as you need for accuracy.

Back On (Single) Track – a KNOWN ‘Track’

Here’s an example of what I like to call ‘Drift’. If you place your waypoints zoomed too far out, then at times, the waypoints will be ‘off the track’. The ‘Course’ in the GPS world, is off from the ‘actual’ course by a few feet. This error DOES add up, and it can make your ride annoying, since the head unit will continually call out the error, and may direct you off the actual singletrack.

Garmin Course Creator Known Trail Drift
Details matter. I had to zoom in on this map, to realize that my waypoints were ‘off’ by just a few meters, and those meters can lead to the Garmin bike computer chirping and redirecting you off the known trail. Use more waypoints, more often, especially in singletrack, and zoom in.

Zoom in and continue to use as many Manually Placed Waypoints as possible, to ensure the greatest accuracy.

One more thing; take a look at the ‘Knuckles’ that have been automatically placed, without a blue-dot waypoint, on this image of the Course Creator. This implies that the App, and corresponding Mapping Service behind or beneath it, recognize this trail as ‘Popular’, and generally follow it through twists and turns.

Automatic Routing on Singletrack is really hit-and-miss, so use Individual Waypoints and Freehand Routing as much as necessary to ensure the most accurate Course.

Looping the Course (Making a Lap) in Garmin Connect Course Creator

Building the Course is definitely tedious, but it’s worth it. Once you’ve finished the Course, get the final waypoint as close to your Start Point as possible, and then click ‘Loop to Start’. This will connect the start to the finish, making each the same waypoint or GPS coordinate.

Garmin Course Creator Loop to Start and Save
When you’re done creating your course, click ‘Loop to Start’ so that the Start and Finish overlap perfectly. Then, ALWAYS and OFTEN, click “Save”, so you won’t lose your work!

ALWAYS click ‘SAVE’!

The ‘CLIMBS’ Button….

Once the Course is saved in Garmin Connect Course Creator, click on the ‘Climbs’ Button, and you’ll get a breakdown of the vertical elevation, as it relates to ‘Category’. Climb Categories are based on % grade, length, and surface type. They’re not especially applicable for this Course, but they can provide some useful information.

Garmin Connect Course Creator Climb Category and Highlight
In the Summary box of the first climb (‘Category 4’), you can see that the average slope is 5.7%, length is 2.46km, and the vertical rise is 144m.


Garmin Connect Course Builder Climb Detail
This detail of the vertical composition of ‘Climb 1’, breaks down the slope percentages. This image also appears on your head unit when climbing, and you can customize that screen to show two fields, like ‘Distance to End’ and ‘Time to End’.

Using the Speed Calculator (Virtual Partner) In Garmin Connect Course Creator

Now, this feature on a course is a little challenging. I need to start with some background.

Per my Strava history, which is NOT Garmin Connect, I’ve ridden this route at least 91 times over the last five years. That would be even higher if I had not moved to Sacramento for 18 months in 2023 and half of 2024. I know that my fastest time on this loop is a 27:10, set in 2020. At the time of this writing, my fastest time this year, four years later, is a 29:36.

A modest improvement would be about 15 seconds on a lap, matching a time from September 0f 2020. So, I’ve set a ‘Goal’ time of 29:17, which translates to 17.6kph. If I achieve this goal, then I can always edit the course, and enter another time, like 29:00 flat.

Garmin Connect Speed Calculator - Virtual Partner Goal Time
Garmin Connect does have segments, which can be ridden and raced, and there are rankings, but that’s another feature to be saved for another day.

“Send to Device” in Course Creator

None of this work bears fruit without having the Course in memory on your Garmin bike Computer. When you’re done with your mountain bike course, ALWAYS click “Send to device”. You’ll get a pop-up asking ‘which device’? Choose your bike head unit, and once again, click, ‘Send to Device’. I prefer using Garmin Express, but it SHOULD sync with Garmin Connect on your Smartphone, and when you sync or turn on the head unit, it should download the course in to your bike computer’s files.

Garmin Connect Send to Device Course Creator
I guess I’m just old school, but I still prefer a cable connection to my 10 series computers for data transfers, and in Garmin World, this means using Garmin Express. You can also use basic Garmin Connect on your smartphone.

I’m going to hold off on the Field Application part of this post, because the intent of this effort was to explain how to build the course itself; not to ride it. I’ll do that part soon.

Stay tuned, and Enjoy the Ride!


Share this:

  • Click to share on Facebook (Opens in new window) Facebook
  • Click to share on X (Opens in new window) X

Like this:

Like Loading...

Written by Richard Wharton · Categorized: Garmin Connect, Mountain Biking · Tagged: Garmin, Garmin connect, mountain biking, Reno Cycling Coach, Reno Mountain Biking

May 31 2024

Vo2Max On Garmin Connect and the Garmin 1040

Vo2Max Calculations Show Cardio-Vascular Changes

Garmin Connect Vo2Max Dial Online Bike Coach Richard Wharton
This is the Garmin Connect Vo2Max dial, located in your Garmin Connect account. It uses information from your traditional heart rate, heart rate variability, and extrinsic measurements like wattage, to glean an indirect measurement. It’s pretty accurate for me, but I’m pretty diligent in comparing it against lab-accurate devices.

Vo2max is a fitness and health measurement that is defined as, “The Maximal Volume of Oxygen that can be consumed by a person during physical exertion.” I’ve discussed Vo2max in the past, and I even own a Vo2Master assessment device, for testing and training purposes. Garmin Connect uses information collected on their head units to determine Vo2Max via a calculation. The data comes from Heart Rate Variability, traditional heart rate, time, and wattage. Testing myself over the years, the data from my Vo2master is about 98% consistent with the data from Garmin Connect. That may not be the case across a wider population, however. That said, the Garmin 1040 Vo2Max post-ride analysis graph is something I enjoy viewing, and then comparing with my own perception of a ride’s efficacy.

In short, I think the Vo2Max reading on a Garmin watch or head unit, as well as in Garmin Connect CAN provide a good and consistent value, showing improvement, stability, or detraining.

Vo2Max On Garmin Connect

Here’s my Garmin Connect Vo2Max Chart. I’m including a 1-year outlook to show seasonal variations with volume and intensity. I’m also showing a 4-week chart to refine the image a bit.

Garmin Connect Vo2Max 1-year report Online Bike Coach Richard Wharton
Vo2Max will wax and wane over time, depending on what type of cycling you’re doing, and what the seasonal demands are for volume and intensity.
Garmin Connect Vo2Max 4-week report Online Bike Coach Richard Wharton
The four-week report for this post culminated in a peak Vo2max of 60 on the week of May 13th. You’ll also notice the drop and rebound. That’s because I moved from 48m above sea level to 1584m above sea level. Vo2Max drops with altitude, and I certainly felt it!

Now – there’s a bit of a caveat here…

The Vo2Max value you see on Garmin Connect is RELATIVE.

It’s looking at:

Milliliters of Oxygen,

per Kilogram of body weight,

per minute of effort.

Let’s start with the TIME requirement. At a minimum, a rolling 60-second maximum effort is needed to get the best information. Achieving Vo2Max is REALLY FREAKING HARD. It should leave you exhausted.

Next, look at body weight. Body weight is one of the most toxic topics a cyclist or coach could ever encounter. Our culture is obsessed with weight and image, but ‘fixing’ it has been a third rail, as our society has only become MORE Diabese and LESS active over the last five decades. Furthermore, there’s the impression that ‘nothing works’. The only thing I’ll say about weight and Vo2Max is… if you want to achieve a higher level of time-limited performance, you need to SMARTLY and STEADILY increase your caloric expenditure while limiting your caloric intake, over time.

I can help, and I have clients who use a Lumen to help with dietary choices, but it’s VERY personal, and it should be a VERY private discussion. You CAN improve Vo2Max with fitness alone; it’s just that losing the weight provides that much more fitness and performance, up to a point that very, very few will ever reach. To be honest, most of us don’t need to, either.

Finally, there’s Milliliters of Oxygen Consumption. This requires a LOT of breathing. It requires that you train to expand your lungs. It requires that you train your diaphragm to suck in as much air as possible, and then utilize it in the bloodstream to the greatest degree possible.  Vo2Max training also requires that you expel as much CO2 as possible, so that the body can treat the strain and continue to operate.

Vo2Max is an indicator of POTENTIAL. It doesn’t guarantee a good ride. Still, a higher Vo2Max is a strong indicator that your fitness and wellbeing are improving from regular training, diet, nutrition, and hydration. ALL of those parameters can be recorded, measured, and interpreted inside Garmin Connect!


How Do I Improve Vo2Max?

Here’s the painful truth; Vo2Max training requires eyeball-popping intervals of high intensity, and a duration of anywhere from 30-seconds to about 6 minutes. For traditional heart rate zones, it’s intensity that elicits heart rate above Threshold, or 85-90% of Max Heart Rate. I recommend Heart Rate Reserve, because in Garmin Connect, it allows for measurement of overnight resting heart rate, and altered max heart rates over time as well.

Here’s an example of a Vo2Max workout on Garmin Connect. Feel free to click and look around. 
The science on Vo2Max training is also evolving. I’m a huge follower of Dr. Veronique Billat, but more recently, Dr. Bent Ronnestad has further studied the effect of different workouts on Vo2Max. Dr. Stephen Seiler, an expat American in Norway, has a decades-old interval set that also has been proven to improve Vo2max.

These are Published, Peer-Reviewed Professionals, who do not use conjecture to make their claims. Garmin’s Heart Rate Variability Research Arm, FirstBeat, has published their own studies in Peer-Reviewed Journals, for decades.

What the Studies Show for Vo2Max Improvements…

The studies all show that for one to improve Vo2Max, you need to spend time near… Vo2Max intensity. In the Garmin Connect world of Zones, I go with intervals in Zone 5 or even 6 (out of 7 zones) for wattage, and above 90% Heart Rate Reserve (HRR). The metabolic response starts to hurt at about 25 seconds or so, hence Billat’s 30-30’s and 60-60’s. Ronnestad tested 30-15’s to good effect. Seiler’s 4×8’s also work, but convincing an amateur athlete to attempt 4 separate 8-minute efforts at such a high intensity has often proved too much.

Now, before I give out advice on how many intervals to do and how often to do them, STOP. Don’t ask. This is why you need a coach. A coach will help with a plan for improvement, progression, periodization, and overall health. Vo2Max efforts should never be performed alone, for safety purposes. They’re highly effective, but they strain the heart and body and mind, and should be performed in a controlled, supervised environment. We do this in my VQ Velocity Virtual Studio; supervised, coached intervals with perpetual feedback about intensity, strain, stress, and training dose.

The 28-Day Vo2Max Graph On Your Head Unit or Watch

The features list on Garmin head units and watches continues to grow. There are so many features, fields, and widgets, that it’s hard to keep up. But one of my favorite post-ride features is the Garmin 1040’s Training Status pages, found in the main menu. Swipe one screen in, and you get this chart:

Garmin Connect, Head Units and Watches look at the empirical HRV data, as well as wattage, to determine Vo2Max. Acute Load is a 7-day average of EPOC, another measurement that is backed by science.

Swipe right, and this image pops up:

The Vo2Max in Garmin’s head units is, in my opinion, better than the display in Garmin Connect.

Keep swiping and more charts come up, along with general guidelines about suggested intensities and how your specific mix of intensity is categorizing you as a cyclist. I’ll blog about that later. But go back to the Vo2Max 28-day chart.

Here’s my post-ride data from March 4th of 2024 through May 31st of 2024. I did not record every day, but I did take screenshots of 58 days out of 88 days. The time block coincided with training blocks of Threshold, Vo2Max, and lately, Sprint/Anaerobic Intervals to really tax the upper limits of the Power-Duration curves of my clients and myself at the VQ Velocity Virtual Studio. I put it into a GIF so you could follow the growth pattern.


28-day growth pattern of Garmin Vo2Max
We began Threshold Training in late January, then transitioned to Vo2Max training on March 12th. Sprint Training began May 7th and will continue on the VQ Velocity Virtual Studio for another two weeks. I’ll explain the ‘Dip’ in Vo2Max in the last week next. In 88 days I raised my Vo2Max from 52 to 60ml/kg/min.

Use the Garmin Vo2Max Chart to Better Understand How Your Training Is Helping – Or Isn’t!

Remember – Vo2Max is an indicator of fitness POTENTIAL. ‘Zone 2’ training is all the rage right now, but it’s been around in scientific circles since the 1970’s. Anyone who remembers Dr. Ken Cooper and ‘Aerobics’, knows about ‘LSD’, or, Long-Steady-Distance. That’s Zone 2. It lays the groundwork for improved Vo2 in lots and lots of ways. But it’s the time spent above Functional Threshold, the time spent at or near Vo2Max, that improves fitness for the biggest bang-per-buck-per-minute.

Garmin Post-Ride Analytics yields a pretty good assessment of how a workout impacted your fitness. The Vo2Max chart, with accurate heart rate and power meter data, can provide a short history, and a future guide, to get the results you want, in a timely fashion.

Stick with it, and if you need help, write, call, or text. The #1 way to improve Vo2Max is through consistent training at any intensity.

Let’s go.

Post-Script: The DIP in my Vo2Max.

In May of this year, I made a sea-change in my life. It cost me some fitness, until my body adapts and I return stronger than ever!


So what happened? Why did I go from 60ml/kg/min down to 54ml/kg/min for a few days, before rebounding back to 58? My body weight stayed the same… So what was it?

Altitude. I moved from Sacramento, CA, back to our home in Reno, NV.

The altitude in Sacramento? 42 meters.

The altitude at my home in Nevada? 1585 meters.

The nearly 10% drop in available Oxygen required about 10 days to adapt.

There’s even a Garmin Graph for that!

Altitude Acclimation Garmin Connect
Adaptation takes time, and special attention to hydration and recovery. One Irish Whiskey can set you back 3 days (don’t ask me how I know!) 😉

After roughly two weeks of shorter breath, a lowered Threshold Power from 305 down to… 258…., I finally started rebounding, and the power is coming back up. Now, I just have to adapt to the upcoming HEAT!

Edging closer to 1585 meters….

That’s all I’ve got for now. If you liked this post, feel free to share it, and as always, click on the button below to buy me a Cup of Coffee.

 
I’ll be back with more next week! Till then,
#ENJOYTHERIDE!


Share this:

  • Click to share on Facebook (Opens in new window) Facebook
  • Click to share on X (Opens in new window) X

Like this:

Like Loading...

Written by Richard Wharton · Categorized: Fitness, Garmin Connect, Vo2 Master · Tagged: bicycle coach, Bike Coach, Garmin, Garmin connect, Reno Bike Coach, vo2master, Vo2max

Dec 14 2023

More Fun With Garmin EPOC

Garmin EPOC – A definition

Garmin Exercise Load Chart 4 Weeks
Garmin uses ‘Load’ and ‘EPOC’ synonymously. Here, in Column 4, you can see multiple ‘Load’ values, and the corresponding ‘Primary Benefit’, which is the topic of this post.

Since restarting regular training in February, I’ve come to enjoy the Garmin Connect Ecosystem and Garmin EPOC. EPOC is an acronym that stands for: “Excess Post-Exercise Oxygen Consumption”. It means this: When you exercise, you burn fat and carbs. The ratios of fat and carbs burned for fuel, depend on cardio-vascular intensities. AFTER the workout, Oxidation, or fat-burning, is important. The amount and duration of fat-burning after an exercise can be assumed via EPOC. Garmin’s EPOC is based on the work of a company called ‘FirstBeat’, which has been studying metabolics and heart rate variability since the turn of the Century and before. Most Garmin Fitness Products these days have EPOC built into the firmware.

Garmin EPOC Assesses Points for a ‘Scoring’ System

Garmin Connect Exercise Load EPOC on Mobile App
You can find the EPOC score under Garmin Connect, by looking in the ‘Stats’ section of an uploaded or synced ride. EPOC and ‘Load’ are Synonymous.

EPOC is work, measured in Kilojoules and Calories, and then scored in a points system. It’s also called ‘Load’. The score is accumulated with time and intensity. Low intensity work translates into scores rising slowly. High intensity work means the scores will rise more quickly.

‘Load Focus’ Over A Rolling 28 Days

In Garmin Connect, I began to notice that before and after workouts, the 28-day ‘Load Focus’ would change, based on daily EPOC scores, as well as the intensities. For general fitness purposes, the ‘Load Focus’ reveals EPOC points, accumulated in three different zones:

  • Low Aerobic
  • High Aerobic
  • Anaerobic

Every ride leads to gains in any of these three zones, and losses as the 28-day window ‘time’s out’. This helps people understand the benefits of consistency, and it can help them better assess their conditioning needs.

How to find ‘Load Focus’ in the Garmin Connect App.

***This is for the iPhone version of Garmin Connect. I own an Android, but have not updated it in months. If asked, I’ll append a new post with that information and directions. Thanks ***

Open your Garmin Connect App, then click on ‘•••’ on the bottom right hand corner.

Next, tap on ‘Performance Stats’.

Tap on ‘Training Status’.

And then, tap on ‘Load’.

You’ll get three horizontal bars, highlighting ‘Load Focus’ (EPOC) points at different intensities.

Load Focus and EPOC

The chart for ‘Load Focus‘ shows the accumulated, 28-day totals, for EPOC in the three zones. The zones are color-coded, and include an oval ‘Optimal Range‘. I’ll be honest. I have NO IDEA where this value comes from, or how it changes. I’ve asked Garmin for more information. I SUSPECT it’s related to the Acute Training Load, Chronic Training Load, and even Sleep Scores and Sleep Strain Scores. However, that’s pure conjecture. Still, it’s not a bad algorithm for cardio fitness!

Here’s a chart of mine from last week.

Garmin Load Focus EPOC
This was taken prior to a midweek workout. You can see that my conditioning is ‘Balanced’, and all of the EPOC 28-day summaries are within the ‘Optimal Range’ ovals.


Now, the workout consisted of multiple 75-second intervals at high intensity, with a 150-second recovery (1:2 w/r ratio), and lasted roughly an hour.

Garmin Connect Power & Heart Rate Chart Connect APP
This is what the wattage and heart rate chart are from this indoor workout.

When we look at a post I made earlier this year on Garmin’s Post-Ride Analysis Reports, EPOC dictates Aerobic and Anaerobic Training Effect. In the “Olden Days”, I would look at time spent in different heart rate zones, to make an assessment about just what a workout might have accomplished. Adding EPOC points and simplifying training zones to, “Breathing, Heaving, Gasping”, adds another degree of interpretation to the information.

Garmin Connect Heart Rate Zone Workout Results
This 60 minute workout included 26 minutes in ‘Zone 2’, just under 5 minutes in Zone 5, and over 10 minutes in Zone 4. The EPOC for this ride was 295 points.


Post-Ride EPOC Zone Placement

With a hard workout that included a lot of time in Heart Rate Zones 4 and 5, almost 25% of the entire ride, EPOC ended up at 295 points. You’ve seen the ‘Before’ chart, now, let’s compare the ‘after’ chart, and see where those ‘Load’ points went.

Garmin Load Focus EPOC
EPOC Prior to the Workout.


Post Dec 6 Garmin EPOC Load Focus Placement
Here’s the Post-Ride Garmin EPOC Load Focus.

Out of 295 Points Earned on this workout, 139 of them were added to the ‘Anaerobic’ zone. FirstBeat does not publish their algorithm, but 139 points is just under one point for every second spent in ZONE 5 of my heart rate intensity.

For the ‘High Aerobic Load’, 155 of the 295 points were placed in that zone. This was enough to skew my Load Focus from ‘Balanced’ to ‘High Aerobic’.

Notice also that ‘Low Aerobic’ did not move. It remained at 1066 points for the 28 days. This leads me to wonder if the points are not assessed position until after the workout is completed. This would make sense.

CONCLUSION – EPOC Is A Scoring System That Works With Heart Rate (and Wattage) To More Accurately Assess Fitness Improvements

I always suspected that EPOC scores directly affected Acute Training Load and Load Focus. I’ll try to assess just how Load changes the Acute Training Load in Garmin Connect in another post. For now, however, it’s just fun to see how a ride with varying intensities of heart rate and power, changes assessments in Garmin Connect. I like EPOC. It’s got the backing of Dozens of studies. The earliest I found has been 1992, and I believe FirstBeat was founded in 2002. EPOC is built into the Garmin Connect Ecosystem. As technology measuring heart rate and heart rate variability has improved, the algorithms for EPOC have also improved.

I think there’s something ‘there’, there, and my clients are enjoying the combination of heart rate, heart rate variability, and power, for a more Holistic approach to cardio fitness on bikes!

Thanks for reading, and ENJOY THE RIDE!

Did you enjoy this post? You can support me by clicking on the button below! Thanks!


Share this:

  • Click to share on Facebook (Opens in new window) Facebook
  • Click to share on X (Opens in new window) X

Like this:

Like Loading...

Written by Richard Wharton · Categorized: Fitness, Garmin Connect · Tagged: bicycle coach, Bike Coach, Cycling Coach, EPOC, Garmin, Garmin connect, Heart Rate Variability, Online Bike Coach

Jul 21 2023

Covid-19 and the Garmin Sleep Stress Score

A Family Member Caught Covid-19 and the Garmin Sleep-Time Stress Score Is Pretty Scary

Garmin Sleep Stress Score Covid 19
A family member caught Covid 19 earlier this week. The HRV overnight status shows just how much stress your heart is under (and therefore, your mind). The GOAL for this is set at ’15’……. Fifteen…..

Three and a half years after Covid-19 spread around the world and began infecting humans, a family member finally caught Covid-19, and their Garmin Sleep-Time Stress Score is pretty scary. Sleep-Time Stress uses Heart Rate Variability (or the lack thereof) to help assess the quality of one’s rest and recovery.

I won’t give away too many details, but a family member traveled overseas and upon their return, infected another family member and their entire department at work. I don’t care what people say or think; getting sick is not fun. The individuals HAD been practicing proper defense mechanisms for years. Vaccines, boosters, masking, distancing, limited travel. But inevitably my family suffered exposure, and another family member, someone I had just helped purchase a Garmin Venu 2+ for, so we could track their sleep and hydration, is now suffering from Covid-19.

It’s Still Not Easy To Set These Products Up.

The purchase of the Garmin Venu 2+ was meant to kickstart some health and fitness choices, based on the information that Garmin Connect provides. Specifically, we were interested in:

  • Sleep Score
  • Sleep-Time Stress Score
  • ECG
  • Steps
  • Hydration
  • and Emergency calling.

All of this can be done with the Venu 2+.

However, and this is a fact that I deal with daily. The Garmin Connect ecosystem is NOT NEARLY AS EASY TO SET UP as its’ Prime Competitor; Apple. Now, I do believe that the information provided is arguably better, but most people just don’t care. They want to set it up in about 2 minutes, and start recording or reading their data.

The good news is that THIS IS WHAT I DO. I set up Garmin head units and watches for and with my clients and family members. With these tools and this ecosystem, I can help make training decisions based on a Holistic approach that is more complete than ever.

My family member was able, with my assistance, to get most of the relevant features up and running. We then were able to immediately begin tracking sleep, blood pressure via a Garmin BP Cuff, and body weight along with hydration status. We are using the Garmin Hydration tracker to help get him to 12 cups of water a day. They’re up to 6700 steps of exercise per day. And most importantly, they were getting their sleeping patterns under control and improving. That part alone is huge. This individual is a direct relation to me, and we both believe that our poor sleep patterns might have a genetic link. When my sleep began to improve via the Garmin Connect system, they became intrigued, which led to this investment.

Pre-Covid Sleep-Time Stress Score

The Images below show a few nights of Sleep-Time Stress Score. The first image was the actual night that this individual was exposed to Covid-19.

Garmin Sleep Stress Score Pre-Covid Saturday Night Sunday Morning
Ignore the medium-stress values; my family member is working through literal decades of poor sleep, and this is something that takes time and discipline to overcome. This was the individual’s Garmin Sleep-Time Stress Score the night on which they were exposed to Covid-19.

First Night With Covid

Sleep Stress Score First Night of Covid-19 infection
This is the Garmin Sleep-Stress Score for my family member’s first night with Covid-19. Exposure occurred on Saturday Night/Sunday Morning, and Infection took hold on Monday afternoon/evening. This image shows the Heart Rate Variability and Stress from Monday Night/Tuesday Morning.


I think this shows just how much the Covid virus hits the heart. For comparison’s sake, the ‘other’ Garmin Sleep Score on Saturday Night/Sunday Morning read: 75. The score for Monday Night/Tuesday Morning, which is this chart, showed: 12.

The Importance of Early Detection

My family member knew almost immediately that this was no regular cold or flu. This individual has had all of their vaccines and boosters, but suffered a medical emergency in October of last year that left them in poor health that has been a struggle from which to recover. So they took this infection seriously.

An at-home test came back positive on Monday evening, and precautions to prevent further illness were taken. Unfortunately, conflicts regarding just who was this individual’s Primary Care Physician led to NO Paxlovid Prescription until Thursday. They just had to wait this thing out.

They isolated, masked up, and another family member, at risk of infection as well, did stay in the room over night because of the coughing spasms and general misery present as the virus spread and the body’s defenses fought it.

Other family members were alerted, and others were identified as infected and were suffering equally. Unfortunately, I didn’t catch it on Garmin Connect.

Night Two of Garmin Sleep-Time Stress Score With Covid-19

https://youtu.be/VMCCE480omU?t=537
The second night spent fighting Covid-19 was not much better than the first. Generic Sleep Score went from ’12’ to ’29’, and Garmin Sleep Stress Score went from 83 to 78. Not much of a drop. Overall sleep was under 3 hours. This is Tuesday Night/Wednesday Morning.

A Remedy

On Tuesday afternoon, after multiple calls to different doctors, my family member was able to successfully arrange for a Steroid shot, as well as a steroid in oral form, in the hopes that that would tilt the balance in their immune system in favor of the body, instead of the virus. Again – the individual had all available shots and boosters, all mRNA-based.

The effect was witnessed over the next several days. By Wednesday afternoon, the perception of illness broke, the coughing abated, and the individual was able to get some rest. Here’s the chart, along with some notes.

Sleep Stress Score Covid-19 48 Hours Post Illness Onset
My family member received a Steroid shot on Tuesday afternoon, about two days after first noticing symptoms of their infection. On this chart, while the first stages of sleep were still stressful, the overall intensity of heart rate stress, combined with the drop around 3am, led to a generic sleep score of 38, with over 7 hours of sleep.

Breaking Through To Normal

By Thursday, it appeared that the illness had abated. I’m not going to proselytize about vaccines, boosters, or fortitude or constitution. What I am interested in is the way that this illness hit the heart in a serious way, and how it was recorded using wrist-based Heart Rate Variability (HRV). They received Paxlovid on Thursday, which was basically too late. Thursday Night/Friday Morning’s overnight Garmin Sleep Stress Score ended up coming down to ’19’, and Sleep Duration was good, almost 7 hours. This is more normal for this individual, pre-Covid.

Thursday Night Friday Morning Garmin Sleep Stress Score Post Covid
Comparing Thursday night’s Garmin Sleep Stress Score pattern to Saturday Night’s pattern (see above), shows more similarities than stresses. I think we dodged a bullet on this one. They also tested ‘Negative’ for Covid-19 on Thursday, and again this morning, on Friday.

Garmin Sleep-Time Stress Score Can Help Identify and Guide You Through This Virus And Others

The sad news here is that my family member DID end up infecting their partner. Again, this other individual had had their shots and boosters. I have NOT gotten their Garmin Sleep -Time Stress Score, but that individual also has a Garmin Venu 2+:  we just haven’t taken the time to get Garmin Connect set up and linked to the phone, etc. That individual is also recovering – their case was mild, they’re on Paxlovid, and never needed steroids.

I guess my point here is this; we’ve got wearable technology that can reveal just what illness is doing to our hearts. Notice that I never even mention Saturated Pulse Oxygen (SpO2) in this post, but that’s ALSO an important metric to measure when ill. I think using overnight Sleep Scores, Hydration tracking, resting pulse and pulse oxygen, and maybe even tracking blood pressure, can help individuals gauge just HOW sick they are, whether that merits an intervention or just rest and electrolytes, and whether the individual is on track for recovery. If the individual is an athlete, this can help with early intervention faster recovery, and maintained overall health and wellness.

Use the Sleep-Time Stress Score when you’re sick and see if it helps you recover faster. Let me know your thoughts.

Thanks for reading, and as always, “ENJOY THE RIDE!”


Share this:

  • Click to share on Facebook (Opens in new window) Facebook
  • Click to share on X (Opens in new window) X

Like this:

Like Loading...

Written by Richard Wharton · Categorized: Garmin Connect, Garmin Fields · Tagged: Bike Coach, Cycling Coach, Garmin, Garmin connect, Garmin Sleep-Time Stress

  • 1
  • 2
  • 3
  • …
  • 10
  • Next Page »
  • Shop
  • Contact Us
  • What we do.
  • How we do it.
  • Why it works.
  • Who we are.
  • What you’ll need.
  • Let’s get started.
  • Blog
  • My account

Copyright © 2025 — Online Bike Coach • All rights reserved.

info@onlinebikecoach.com   |   (1) 214-616-9850   |     |  

  • Shop
  • Contact Us
  • What we do.
  • How we do it.
  • Why it works.
  • Who we are.
  • What you’ll need.
  • Let’s get started.
  • Blog
  • My account
%d