Online Bike Coach

Where Cyclists and Triathletes get Faster/Stronger/Leaner/Sooner

  • Shop
  • Contact Us
  • What we do.
  • How we do it.
  • Why it works.
  • Who we are.
  • What you’ll need.
  • Let’s get started.
  • Blog
  • My account

Jun 05 2023

Garmin Connect HRV Status Update

Garmin Connect HRV Status Is FINALLY Showing Some Improvement – And I’m Feeling It!

This Garmin Connect HRV based Ecosystem Is really getting interesting. I’m literally using just about everything Garmin; The Scale, the Watch, and the Head Unit. I probably ought to buy a Neo 2t and a pair of pedals, but I’m fine for now with my current setup. I know there is debate over the accuracy of NIRS, the validity of the FirstBeat HRV claims, but let’s face it; no other company is showing the commitment to data collection and general health guidelines like Garmin Fitness. It’s not cheap, but I think the long-term gains for overall health and wellness are working. The Garmin Connect HRV Status shows overnight heart rate variability, and I think the combination of regular exercise, a new bed, a more private bedroom, a LOT less alcohol at night, and a LOT more water throughout the day, is leading to better sleep, and better rides.

***Before we go any further, I’m curious to know if you think these blog posts are informational. IF you feel like they are, then .

Garmin Connect HRV Status Shows How Sleep Is Leading To Better Workouts – and Vice-Versa

Have a look at my 6-month TREND for HRV Status.

6 Month Garmin Connect Training Status Report Including HRV Status
This is the 6-Month Training Status Report from Garmin Connect. Specifically, look at the third chart; HRV Status. It shows the incredible stress I was under at the end of last year, which resulted in a severely suppressed HRV status. Once I started simply walking the dogs last winter, and we had a home we could call our own (that’s a whole other story that remains unfinished), the HRV Status began to stabilize, albeit still ‘low’ (stress) and ‘Tight’ (again, stress). Once I started training regularly again in February of this year, however, HRV Status began to stabilize, and it’s FINALLY starting to rebound, which I’ll show in the next image. Also take a look at the Garmin Connect Acute Training Load, below HRV Status. As my training load grew, HRV Status actually improved, and it was on the days where I rode an acute overreach that the HRV Status dipped back into ‘Unbalanced‘ Territory. We’re Tempering Action With Wisdom.

Now, here’s the corresponding 28-day trend, which is a bit of a close-up of the 6-month chart.

28 day Garmin Connect HRV Status April 26 through May 23rd 2023
The dots on this chart represent a rolling 7-day average of HRV Status, measured at night, from the time I fall asleep to the time I wake up. The grey zones represent a baseline range. I’ve been told that my range is too low (too stressful) and too tight (again, too much stress), but I’m encouraged by the STABILITY I’m seeing in this chart, and the RISING TREND as well. This means that I AM recovering better, and sleeping better to some degree. And as we know, a good night’s rest is critical to a good day’s performance.

Is it leading to better results?

Honestly, I don’t yet know. I am confident that my Threshold is improving, and I believe that my Anaerobic Work Capacity is growing. More importantly, I’ve started losing weight, and I just ‘feel’ better, all around. The first chart shows that Vo2 Max is improving, and I think I could probably break 300 watts for 20 minutes if I really tried. But I’m not ready yet to tax my system like that. I want to focus on consistency, and on learning as much from this Garmin Connect ecosystem as possible. There is SO MUCH DATA available!

Garmin Connect Body Weight 1 Year Graph
I’m convinced that a good night’s rest and improved overnight HRV Status, leads to better workouts with higher calorie counts. This leads to a more optimal weight. I’ll continue to avoid alcohol and increase my caloric expenditure, especially on weekends, to try and achieve my goal of 70kg. If I start to lose fitness because I’m too light, I’ll report that.

Garmin Connect HRV Status and Periodization

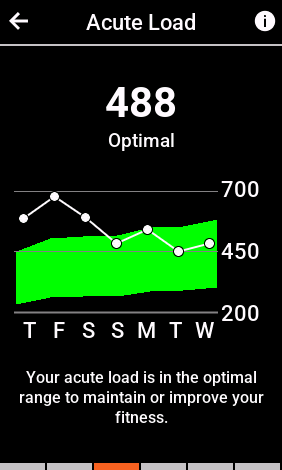
If you look at my Acute Training Load chart, you may see that the black line, which is a rolling 7-day average of TRIMPS. It’s bouncing near the bottom of the Green zone, known as the ‘Optimal Range’. This is intentional. I’m backing off on the intensity for the week, to avoid a fitness plateau and stale performance. My clients on VQ Velocity are really enjoying this hybrid approach to Physiology and Physics. 8 weeks in, and we’re set for one of our best summers of activity yet. I’ll be attempting a new 20-minute breakthrough next week, along with a new Threshold and Vo2 Max. I like to attempt these indoors, because it’s consistent. But if the HRV Status or Sleep Scores trend in the wrong direction, I’ll listen to my body, and will delay Breakthrough Efforts until I’m recovered and mentally prepared.

HRV Status Is One More Metric That Can Help With a Holistic Approach to Training, Recovery, and Fitness.

I sell these watches. I love these things. Any cyclist who owns a Garmin head unit and is half-serious, needs to be looking at this stuff. I DO think it’s accurate enough and consistent enough to be effective. I can’t wait to see just how fit I can become, with my clients as well. This is my new platform going forward. We’ll be migrating to this HRV-based ecosystem for the majority of our cycling, and then use wattage for those SUPRA-THRESHOLD efforts that require taxing the Central Governing Theory to its’ limits.

Thanks for reading, and ENJOY THE RIDE!

Share this:

  • Click to share on Facebook (Opens in new window) Facebook
  • Click to share on X (Opens in new window) X

Like this:

Like Loading...

Written by Richard Wharton · Categorized: Garmin Connect · Tagged: Bike Coach, Cycling Coach, Garmin, Garmin connect, Garmin HRV Status, HRV, HRV Status

Mar 09 2023

Garmin Connect Fitness Metrics – 2 Weeks In

The Garmin Connect Fitness Metrics Provide More Information and Guidance

I’m now about 2 weeks in with my study of the metrics that are provided by Garmin Connect. The consistency with which I have been measuring HRV Stress in the morning, and Performance Condition during a workout, is yielding some informative results. I’ve also started to study HRV Status (an overnight reading of heart rate variability), and sleep score. I’ll report about those metrics now and in more detail in future posts.

What Goes Into My Thought Process Via Garmin Connect Data?

My thought process for the Garmin Connect interpretations is as such:

  1. Wear the Fenix 6 as much as possible, to measure HRV Status overnight, get Sleep Score, and track Hydration.
  2. Once I’ve awakened, I study the HRV Status to determine whether it is trending up, down, or within an acceptable range.
  3. Look at Sleep Score and specifically look at Deep Sleep. I need to break 52 minutes of deep sleep, and I REALLY want to get more than 6 hours of consistent sleep, but honestly, that’s a real challenge for me at this time.
  4. Take an HRV Stress test after coffee and a bathroom break. I’m sort of skipping breakfast so I can exercise mostly fasted (I use cream in my coffee).
  5. After the ride begins, if my “Performance Condition” comes out highly positive, I’ll ride for time and volume. If it’s neutral, I’ll ride for base. If it drops quickly over the first 20-30 minutes, I usually focus on LOW intensity base cycling, and try to achieve an EPOC of about 100-150 at the most right now, and then an Aerobic TE of 3.0-3.5, with no Anaerobic TE.
Garmin COnnect Training Status Reports
The Garmin Connect Training Status Report area is perhaps my favorite section of Garmin Connect. That said, I WISH I could expand these charts to get a little more detail than what it shows in this summary page.

Most of my rides have been indoors, due to weather, time commitments at the house, and a general lack of knowledge about routes and group rides in the area, since I’m new to town. This has been the wettest winter in decades, and I want to show up for any group rides prepared fitness-wise. I also want to study this stuff, so we can all use it more effectively.


The results have been pretty good so far.

Garmin Acute Training Load Chart 1040
This chart is available in the ‘Training Status’ page in Garmin Connect, but I thought I’d show it from the Garmin 1040, because, honestly, it’s sharper. It shows decent growth in volume, and it provides a general ‘Ceiling’ and ‘Floor’ of EPOC over a rolling 7-day accumulated average. At least I think that’s what it’s telling me.


My overnight HRV Status, after some initial disruptions due to outside stress factors, has largely stabilized.

Garmin HRV Status Report
When overnight HRV Status is stable or within a known range, Garmin/FirstBeat is implying that I’m okay to exercise and probably increase my volume and intensity. That’s something I would like to do, so I’ll be using the above EPOC measurement chart (see previous graph) to continue getting more overall volume, but within the limits set by Garmin Connect’s algorithm.


Garmin Connect Sleep Score 4 Weeks
The Garmin Connect Sleep Score is not my idea of the perfect measuring stick, but it is what it is, and it’s inside the Connect Ecosystem, so that’s what I’m using. I would LOVE to talk with someone about pulling the EEG data from a Muse S app, and sticking it into Connect, which is something that apparently can be done with an API or SDK. I think the EEG is more accurate.


Garmin Connect HRV Stress morning test Report
When you don’t always know where your next meal may come from, you tend to have a little higher stress some mornings. Today’s HRV Stress was at a 45, so I did a shorter, but harder workout just to get some of that stress OUT of my life! 😉


Garmin Connect Performance Condition With Heart Rate Overlay -4
This was today’s “Performance Condition” chart. It started off at a neutral value, and declined over the course of 45 minutes. The HRV Stress was in the mid-40’s, the Sleep Score was pathetic, even though my impression of my sleep quality was high.


Garmin Connect 7-Day HRV Status overnight Averages LOW
Here’s the final piece of the puzzle; my overnight average of HRV values. I THINK this is the tell-tale heart value, right here. HRV overnight was ‘low’, meaning slightly more stress, and even though in my perception, I slept well, the data just doesn’t show it. Ergo, my Performance Condition was Middlin’ at best, and then it just declined over the 45 minutes or so that I rode. Any attempt at real intensity was not to my advantage.

CONCLUSION

Looking back at several of the factors, like Sleep Score, HRV Stress, HRV Status, and the initial HRV Performance Condition value, it was evident that there was not much I could accomplish today on the bike, other than a moderate ride. Instead of attempting any intervals or even an FTP test (I keep playing with that feature on the 1040 and will accomplish it some day for a blog post), I should have gone easy.

The Garmin Connect ecosystem is teaching me, but I’m not always listening. I’ll continue to look at this guide, and share my results with you as we go along.

Thanks for reading, and ENJOY THE RIDE!


Share this:

  • Click to share on Facebook (Opens in new window) Facebook
  • Click to share on X (Opens in new window) X

Like this:

Like Loading...

Written by Richard Wharton · Categorized: Fitness, Garmin Connect · Tagged: Bike Coach, Cycling Coach, Garmin, Garmin Acute Training Load, Garmin Aerobic Training Effect, Garmin connect, Garmin EPOC, Garmin HRV Status, Garmin HRV Stress, Garmin Performance Condition, Garmin Sleep Score

  • Shop
  • Contact Us
  • What we do.
  • How we do it.
  • Why it works.
  • Who we are.
  • What you’ll need.
  • Let’s get started.
  • Blog
  • My account

Copyright © 2025 — Online Bike Coach • All rights reserved.

info@onlinebikecoach.com   |   (1) 214-616-9850   |     |  

  • Shop
  • Contact Us
  • What we do.
  • How we do it.
  • Why it works.
  • Who we are.
  • What you’ll need.
  • Let’s get started.
  • Blog
  • My account
%d