Online Bike Coach

Where Cyclists and Triathletes get Faster/Stronger/Leaner/Sooner

  • Shop
  • Contact Us
  • What we do.
  • How we do it.
  • Why it works.
  • Who we are.
  • What you’ll need.
  • Let’s get started.
  • Blog
  • My account

Oct 16 2024

Vo2Max and Mountain Biking

Mountain Biking Requires Riding at Vo2Max!

Vo2Master outdoor data collection.
Cross Country Mountain Biking Requires working at or near your Vo2Max for an extended period of time.

CAUTION – THIS POST IS NERD-HEAVY! IT IS DEEP IN THE WEEDS! DO NOT HESITATE TO ASK QUESTIONS!!!!!

Ever since I received my Vo2Master back from my friend and code buddy in Canada, I have been collecting data on inside and outside rides. Not long ago, I rode two laps of my favorite Cross-Country Course, using my Mask, a Moxy, and a Rotor Power Meter, to learn just how hard I was working, and how I might be able to get some faster splits on the climb.

The Course

The course for this study is my all-time Peavine Favorite, which I built in Garmin Connect in a previous post. The course covers 8.6km, climbs 215 meters, and my best time on the loop is about 27:10, though I haven’t seen that time since 2020. I’m convinced that Mountain Bike Cross Country Courses change with use and weathering, and let’s face it – I’m four years older, and probably a little more skittish now than I once was. Health Insurance deductibles are always in the back of a cycling coach’s mind!

This year, my fastest time is a 29:36, and that happens to be the fastest time since a race was held on this course in 2019. It’s my home course, and I spend HOURS on the loop, trying to decipher bike fit, suspension, and tire pressure. When winter shuts me down, this trail is what I dream of for the next spring.

Vo2Max for Climbing on a Mountain Bike

The Climb section of this course starts immediately. The first section is 2.46km, and climbs 144 meters at an average of 5.7% slope.

The second segment, just a few minutes later, is 1.37km long, and climbs 54 meters at 3.9% slope.

My fastest time for this climb was set in 2020, at 10:33. My closest time this year, however, has been an 11:26. My weight, however, is about the same, at 69kg. The bike weight is similar, though it is a new bike. The difference is that I’m four years older, and maybe the trail has degraded somewhat over those four years.

The ride we’re studying occurred on August 15th, 2024. Here’s the link to the file:

Physiological Demands

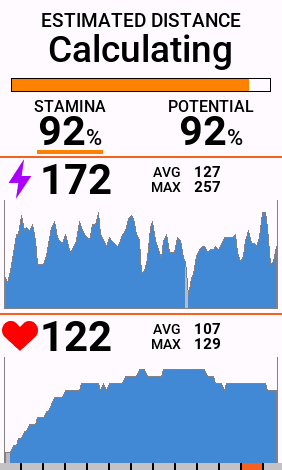
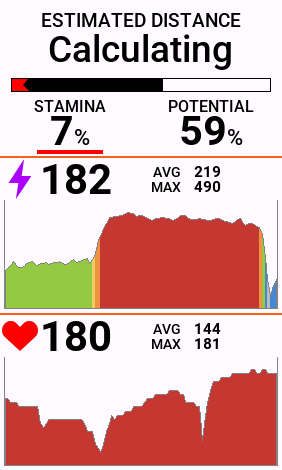
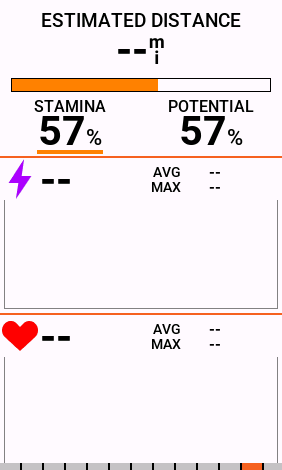
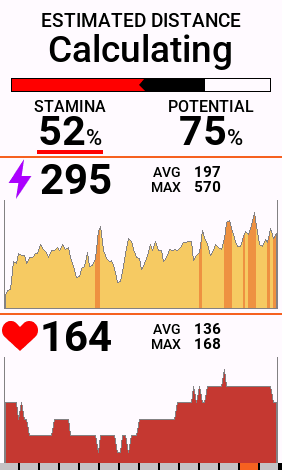
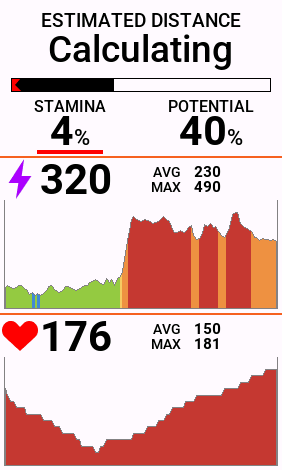
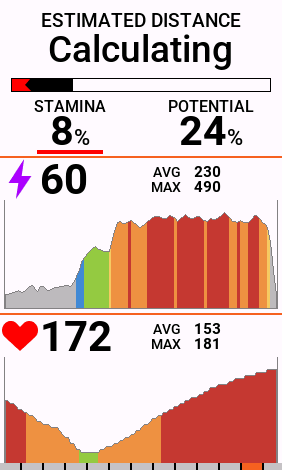
I really wanted to see how much Strain was required to perform the climbs on this course, so I gave it all I had. I wanted to witness more than just power and time. I wanted to observe Vo2 demands, Saturated Muscle Oxygen values, Respiratory Rate, and more.

Here are a few graphs of the first climb. I think the results are pretty interesting.

Vo2Master Vo2 and SmO2 while MTB Climbing.
This first image highlights Vo2, elevation, and SmO2. You can see how SmO2 stayed suppressed below 20% for a good chunk of the first climb, roughly corresponding with the high Vo2. I believe my Vo2max is about 62ml/kg/min, and for this climb, I am estimating I climbed it at about a 55ml/kg/min, or 89% of Vo2max. Note also, just how quickly SmO2 recovers when terrain changes, as opposed to Vo2, which takes slightly longer. The legs provide the ‘Demand’ side of the equation, while the lungs in this case reveal the metabolic cost of this demand. 
Vo2master Garmin Connect Vo2max Vo2 Threshold heart rate mountain biking climbs
Traditional heart rate definitely seems to correlate with Vo2 on this effort. However – it does seem like the heart rate ‘drifted’ higher with the effort, while Vo2 was roughly steady, especially around the 14:45 mark. I tend to throw out the short spikes of Vo2, and in after-action, I always try to export the file and extract the highest Mean Max Vo2 for the duration I’m observing.
Vo2Max Mountain Bike Watts Stochastic Power
This is the same time span, showing Vo2 against power on the climb. Look at how incredibly stochastic the wattage is! This is created by terrain and changes in direction, but the metabolic costs (see the above charts showing SmO2, Heart Rate, and Vo2, all remain more consistent. Wattage dictates lots and lots of small, tiny gains, measured in single meters.
Vo2Master Vo2 DFAA1 DFAA-1 DFA Alpha 1 Alpha HRV AlphaHRV
I know there’s debate about the efficacy of DFAA-1, but I thought I’d show it anyway. Compare Alpha1 to SmO2. I usually dictate SmO2 at Threshold to be about 17-20%, and I usually use 0.4 -0.5 for Threshold at DFAA1. For the majority of this climb, once the calculation caught up, DFAA-1 was below 0.5, and was below 0.4 at times as well. It IS useful, especially for longer climbs.

Results

Okay – this is where things get crazy.

I have to believe that some of my results are wind and temperature aided. However, glances on www.wunderground.com history, just do not provide the details I believe are necessary to provide proper context. I also believe the trail conditions change over the course of a season, and over the course of years. I know I’m getting older, and with that age, a lower Vo2max and diminished power at Threshold, but I also believe that I’m giving this climb my best effort. This year alone, I have climbed this hill 24 times, with a best result of 11:26. August 15th’s ride was, however, a lowly 12:31, my seventh-best time this year.

Ironically, on August 18th, I climbed this hill in 12:04, and on August 25th, just 10 days later, I finished in 11:28. Unfortunately, I was not wearing my Vo2Master for those rides. I may follow up this post with an analysis of those rides, since I was using the Moxy, and AlphaHRV on my Garmin 1040.

That’s the Bad News. The Good News is that it’s the fastest time on this segment on Strava for the year, and it’s the fifth-fastest time ever. I now have the Vo2, SmO2, HR, and power metrics needed to determine how to actually IMPROVE my time through increased fitness!

Conclusion

Mountain Biking demands a lot of effort at, or near, your Vo2Max!

I now know just what the physiological parameters are for this climb. Knowledge comes from data, and the data revealed so much. I’m going to work on my 10-minute average power values, and power at roughly 54-55 Vo2. I’m going to work on leg strength, and overall body strength. I still don’t believe I have the best bike/body position for climbing, and I’m going to study that and make changes.

The beautiful thing about mountain biking is that the same course, the same segment, the same trail, is NEVER, EVER, EVER the same. Rocks move. Moisture comes and goes. Wind erodes. Some areas get softer, some areas get more packed. These are all things that GPS trackers cannot measure, and on-bike and on-body metrics can’t perceive or analyze.

I’ve spoken before about a term I learned when I was flying sailplanes. It’s called “Whipadilling”, and it’s sort of a 6th Sense. In aviation, it’s the ability to ‘read the air’ and ‘see the sky’. For me, on a mountain bike, it’s about reading the terrain, picking lines, making mistakes, rolling over those mistakes and remembering the next obstacle. There are SO MANY VARIABLES. The goal, however, is to optimize what I can on my body and my bike, and then practice, practice, practice, until the trail shuts down for the season, due to rain, snow, and short days.


Until then…

ENJOY THE RIDE.


Share this:

  • Click to share on Facebook (Opens in new window) Facebook
  • Click to share on X (Opens in new window) X

Like this:

Like Loading...

Written by Richard Wharton · Categorized: Uncategorized · Tagged: AlphaHRV, DFAa-1, mountain bike coach, Moxy, Peavine, Reno Bike Coach, Reno Mountain Biking, Vo2 master, vo2master

Aug 12 2024

Vo2Master Vo2Max Value Affirms Garmin Vo2Max Estimator

Vo2Master’s Vo2Max Value Was 98% Consistent with Garmin

Richard Wharton Vo2Master OBC Headquarters
THE THINGS I DO FOR SCIENCE!

In May of this year, I wrote a post about the Garmin Vo2Max Calculator. In July, I was able to test my Vo2Max at OBC Headquarters, to compare values. I performed a Graded Exercise Test, using the Vo2Master app. This app, on a cell phone, trapped data from multiple sources. The Vo2Master’s Vo2Max value showed a 1-point difference from the calculation to the actual results.

Let’s take a look at what I learned about myself.

Remember – Vo2 is translated into: ‘Volume of Oxygen Consumed’. It’s the rate at which Oxygen is absorbed by the body for use in muscle contraction and life-sustaining activities. The Greeks believed that breath was life… and they were right.

The Vo2Master Provides a TON of information!

Vo2Master App Metrics
This is just one page of data fields that I can use on the Vo2Master app. You can also run these fields as graphs. All of the data is stored in a detailed .csv file that can be downloaded and shared for analysis.

Since it launched over 5 years ago, the Vo2Master app continues to improve. Just about any sports fitness product that has Bluetooth transmission can now be recorded. These myriad data points can also be displayed, in numeric or graphical format. My only complaint about this has been the inability to display and record this information on a larger screen, like that found in a laboratory or on a regular PC. But that’s a side project that I’m actually working on via (fitnesshrv.com). The app can also be simulcast from a phone or tablet to a large screen with 3rd party apps or with Apple TV.

For this test, I recorded the following external data points:

  • Load Generator (Ergometer)
  • Power (crank)
  • Heart Rate (chest strap)
  • Heart Rate Variability (HRV)
  • Cadence (crank)
  • SmO2 (Moxy)

These data points allow me to transfer the information learned in from the Vo2Master, over to my body and bike when I’m cycling outdoors.

For the ‘Native’ Vo2Master data, I recorded:

  • Respiratory Frequency
  • Tidal Volume
  • Ventilatory Exhalation in Liters per Minute
  • Expired Oxygen

ALL of this information was recorded on a single .csv file, and a summary report was delivered after the test ended.

Any information that was able to be transmitted via Ant+ signal, was also recorded on my Garmin Head Unit.

Vo2Max Test Parameters

I can build just about any test protocol I wish to construct, but the most common Graded Exercise Tests for Vo2Max are built like this:

  • A decent warmup that includes instrument and ergometer calibration to ensure accuracy.
  • 2-4 minute stages at preset wattage loads.
  • A 25 to 30-watt jump (“step”) at the end of each stage.
Vo2Master Graded Exercise Test App Protocol
The Vo2Master app can perform Graded Exercise Tests, ‘5-1-5’ type tests, and even training intervals. Variations within each set are based on time and intensity.

For this test, I had already warmed up, so I just chose a 5-minute warmup, 3-minute stages, and a 30-watt jump in each step.

The Test

Vo2Master Graded Exercise Test
The area in grey is the exercise load. Purple is the power coming off of my power meter on my bike. Red is my traditional heart rate. Blue is the Vo2 data coming from the Vo2Master.

The test was performed on July 14th of 2024. The previous week, Garmin Connect had my Vo2Max calculated at 57ml/kg/min. The Primary goal was to determine the accuracy of this number. The secondary goal was to determine Ventilatory Threshold #1 (VT1) and Ventilatory Threshold #2 (VT2) to see if those wattage, heart rate, and other physiological results, were in-line with the Calculations made by Garmin Connect.

*** Remember – this is just ONE individual performing ONE Graded Exercise Test. There’s nothing linear or broad. I’ll add to this information over time, but it’s just a snapshot of my fitness, compared to a mathematical algorithm by a fitness company.

I began the test at 100 watts of resistance, which was then raised by 30 watts every 3 minutes. I ended the test at roughly 300 watts of ergometer load, when I was exhausted, and my Max Heart Rate was at a value I hadn’t seen in about 6 months.

A Few Problems with the Data

When you look at the graphs I’m providing, you’ll see that there are two problems with the data, neither of which is enough to discount the information in it, but it IS important to understand the results.

Vo2master test anomalies
I’ll perform this test again some time, using an axle or spider based power meter. I may also acquire the ‘other half’ of the power meter (the left leg – this is a rare, right-leg-only pm), and show why 2-legged pm’s are so much better.

First – there’s a glaring delta between the Ergometer Load and the Power generated. Those two values should be roughly 1:1 (Power should be roughly equal to the resistance provided, per Newton’s Third Law). The Power lagged behind the Ergometer load the entire ride, even after calibrating both devices. I believe the data from the power meter is accurate, however, and it’s the information I would use outdoors or in training. So, while it’s not in line with load, it does still provide valid data.

Second – the power line itself is variable. I blame this on the fact that I use a one-legged power meter indoors, and the data packets can ‘speed up’ or ‘fall behind’ at certain cadences. I’m fully aware of the shortcomings of one-legged powermeters, which is why, when I ride outdoors, I truly prefer axle-based powermeters, and more specifically, ‘two-legged’ power meters that trap the torque on both cranks, and use the information to compute a more accurate and thorough set of data.

For this test, the average for each step was fine, but in the future, I will make two specific changes. I’m going to purchase a more modern trainer, and I’ll purchase the ‘other leg’ of my power meter, so I can get the more accurate information for my indoor-only bike.

Vo2Max Results

The most important question I wanted to know was what the Vo2Master would show my Vo2Max to be, and what that value was in relation to the calculated estimation of Vo2Max from Garmin Connect.

Here are the results:

Vo2master Vo2max Graded Exercise Test Report Results
This is the first page of the Graded Exercise Test Report from Vo2Master. I basically blew a 56 Vo2, which lines up with the calculation that my Garmin Connect has made, at 57 just a week before.

The Vo2Master trapped my Vo2Max at 55.8 milliliters of oxygen consumed per kilogram of body weight per minute of exertion.

Garmin Connect had recorded a 57 about a week earlier. That’s 98% consistent.

I’ll Take it.

Other Fitness Data Points

If you know anything about me, you know I’m a nerd for Data. The goal for me as a Coach, however, is to help ‘distill’ this information in to practical knowledge. That’s why I focus on lower-cost alternatives and Garmin Connect, to set fitness levels, training zones, and fitness programs. Progression does require frequent re-assessment, however, which is why I like using the Vo2Master. It provides the ultimate, scientifically validated information that we can then use to reset these zones with more accuracy.

Vo2master Heart Rate Vs Wattage Graph with VT1 and VT2
The linear plot between heart rate and wattage is nice, but it’s even better when you plot VT1 and VT2 against the other two metrics. This gives you the knowledge to understand just how ‘hard’ you can ride before physiological and metabolic changes in energy consumption start to occur.

Ventilatory Threshold 1 (VT1)

Ventilatory Threshold 1 (VT1) is a point in time where the Respiratory Rate (RR) or Ventilatory Exhalation (VE) in Liters per Minute, outpaces the rise in Vo2. It is ROUGHLY analogous to Lactate Deflection Point #1, which is an invasive measurement that uses needles and blood to assess the processing of lactate as energy. When that value rises, exercise physiology changes energy use from mostly fat consumption – to fat and carbs consumption, to overwhelmingly carb use for energy. Lactate testing is invasive, adds risk, and the data collection is prone to error. As a result, I use Saturated Muscle Oxygen from a Moxy, and I also use DFAA-1, a measurement that looks at Heart Rate Variability, to assess these intensities, when I’m not wearing a Vo2Master.

Vo2master Gas Exchange FeO2 and EqO2
While I’m not discussing this chart in this blog, the information it’s providing is priceless. FeO2 is expired oxygen. If less o2 is exhaled, that means more is in the bloodstream and is helping the muscles with contraction. It shows the ‘Air’ in ‘Aerobic’ Exercise!

The Garmin Connect system, paired with Garmin bike computers and watches, uses power, heart rate, heart rate variability, respiratory rate from the chest strap, and weather information, to come up with heart rate and wattage zones. These values CHANGE with changes in volume and intensity over time, which is one more reason why I’m intrigued with what the Vo2Master has to say, in relation to the zones set by Garmin Connect.

Garmin Connect Algorithm Vs. Vo2Master Gas Exchange Results

Vo2master with Tidal Volume Ventilatory Exhalation and Respiratory Frequency
Here’s another Graph of the Vo2Master data plot. My Tidal Volume, at 3.7 liters, is actually a bit low; I need to train for deeper, slower breathing. This will delay the onset of VT1 and VT2, and thus improve my economy.

Here’s the comparison between the Vo2Master Zones, and the Garmin Zones after the test.

VT1/Zone 2 ‘Fat Burning’ Zone…

  • Vo2Master: 142 Beats Per Minute for VT1. Below that value, let’s call it ‘Zone 2’
  • Garmin Connect: 145 Beats Per Minute.
  • That’s a 2% difference.
  • VT1 Wattage Value? 183 watts
  • Zone 2 Upper Value for Garmin Connect: 179 watts.
  • That’s a 2% difference…

VT2/Functional Threshold Heart Rate and Power…

  • Vo2Master: 174 Beats per Minute. This is the ‘zone’ above which you’re on borrowed time, and below which, you can still exercise for an extended duration.
  • Garmin Connect? 172 Beats per Minute.
  • 1% delta. Again – I’ll take it.
  • Vo2Master Wattage at VT2/Threshold? 251 Watts.
  • Garmin Connect? 247 Watts.
  • A 1.5% delta. Again – for fitness purposes, I’ll take it.

Setting SmO2 Zones Based on Vo2Master Data

Once the VT1 and VT2 Values for wattage and traditional heart rate were set, I then took a look at the Saturated Muscle Oxygen information at those breakpoints.

Vo2master With SmO2 and ThB Values from a moxy monitor
I love, love, love my Moxy Monitors. They offer a noninvasive way to measure intensity on the ‘demand’ side, while heart rate provides information on the ‘supply’ side. Note the inclusion of Total Hemoglobin, or ThB. Thb declines until I reach VT1, then plateaus in my ‘tempo zone’, then begins to rise as I surpass Functional Threshold Power, or VT2.

Here’s what it showed:

  • SmO2 at VT1, where heart rate was 142 bpm and wattage was 183 watts, showed 37% saturation on my Left Lateralis. I usually use 40% saturation as my VT1/LT1/Zone2 breakpoint, so this value is in sync with my perception.
  • SmO2 at VT2, where heart rate was 174 and wattage was at 251 watts, was at 19% SmO2 Saturation. Again – I tend to use 20% saturation as the mark for my VT2/LT2/Threshold.
  • SmO2 measured by a Moxy on my Left Lateralis, showed highly correlated values with VT1 and VT2 for wattage and heart rate. That’s now three datapoints I can use when training, indoors and out, to correlate with the Gold Standard of Gas Exchange Analysis.

There are some great studies which show how SmO2 is equally valid to Lactate testing. The advantage is that SmO2 is noninvasive. I use SmO2 daily, and rely on it for optimal warmup and vasodilation, as well as for monitoring hydration and even looking at Moxy highs and lows during intervals, to gauge exhaustion more accurately. Most of you reading this already have a Garmin watch or bike computer and an advanced chest strap. Investing in a Moxy can augment your knowledge and improve upon your intuition about intensities and the duration you can ride at those levels.

Conclusion

Vo2Master GXT Zone Prescription
I usually simplify the 5 zones to just 3. Stay below 142 for base, stay above 174 for Vo2Max intensity, and work intervals above and below 251 and 183 watts (these will change with fitness).

The Vo2Master’s Vo2Max readings confirmed the calculations I am getting from Garmin Connect. Correlation between Vo2Master’s VT1 and VT2 for wattage, heart rate, and Saturated muscle oxygen, was also high.

The Vo2Master is the pinnacle of portable, accurate, physiological testing. I’ll be using it on some outdoor rides on the mountain bike to show just how hard mountain biking is, and how we can use that information to better train and prepare. Perhaps more importantly, at least in my case, the Vo2Max calculated through Garmin Connect, along with the thresholds and zones, means that I can train with higher confidence, knowing that the physiological data backs up Garmin’s claims and assumptions to a really high degree!

Thanks for reading, and #EnjoyTheRide!

Share this:

  • Click to share on Facebook (Opens in new window) Facebook
  • Click to share on X (Opens in new window) X

Like this:

Like Loading...

Written by Richard Wharton · Categorized: Fitness, Garmin Connect, Moxy, Uncategorized, Vo2 Master · Tagged: Bike Coach, Cycling Coach, cycling fitness, Garmin, Garmin connect, Moxy, Richard Wharton, vo2master, Vo2max

Jun 19 2023

Garmin Stamina and Stamina Potential – A Native Feature Gauging Fatigue

Garmin Stamina and Stamina Potential May Just Be the Enlightenment Tool for Cyclists and Triathletes!

Garmin Stamina and Stamina Potential Cover Graphic
Garmin Stamina is a new, Native feature that shows, in realtime as well as in post-ride analysis, how much you’ve got “Left in the Tank”, as well as the POTENTIAL for what’s “Left in the tank”! Let’s learn some more.

With the release of the ’40 Series of Garmins (the 540, 840 and 1040), as well as a host of watches, Garmin has included the Garmin Stamina and Potential feature. This native Field looks at energy use, intensity, heart rate and other elements to gauge ‘Just how much is left in the tank’ when a cyclist or runner is exercising. It’s one more tool that a cyclist, runner, or triathlete might be able to use for training, breakthroughs, or in an event.

What Is Garmin Stamina?

Garmin Stamina and Stamina Potential Screen Garmin 1040
Ride ‘Blue’, and Garmin Stamina and Stamina Potential will still decline. Fatigue happens, no matter what.

Garmin Stamina is defined as a visible metric that reveals just how much a cyclist has left, in terms of residual energy, power and work, at any capacity, over time. When a cyclist rides harder, Stamina drops faster. When the cyclist recovers, Stamina rebounds. Garmin Stamina is measured in %. If a cyclist is fresh and recovered, Stamina will start at 100%. If this is their second workout of the day, or they haven’t adequately recovered from a previous effort, it may start at <100%.

What is Garmin Stamina Potential?

Garmin Stamina and Stamina Potential Early In an Interval Set
Garmin Stamina is using a pretty complex, really proprietary, algorithm to measure fatigue and work capacity. I think it’s looking at that gool ol’ Wattage, Heart Rate (Variability), Temperature and Cadence combination. It’s pretty cool.

Garmin Stamina Potential shows just how much fatigue is affecting a cyclist’s ability to generate power. I remember Dr. Allen Lim, in 2004, telling me about requiring his athletes to use at least 600 KiloJoules of energy prior to performing intervals, because “500 watts after 600 KiloJoules is a LOT HARDER than 500 watts after just 200 KiloJoules!” And he’s right.

Garmin Stamina begins on a scale of 100-0%, and it declines with Garmin Potential as a ride progresses.

The Garmin Stamina Page On Your Garmin Head Unit

If you have a new ’40 Series, turn on the Garmin Stamina Page by following these steps:

  1. On the main screen, tap on the ‘Sandwich’ Square.
  2. Tap on ‘Activity Profiles’.
  3. Pick a Profile (I have ‘Road’, ‘Indoor’, and ‘Mountain’).
  4. Tap on ‘Data Screens’.
  5. Scroll up and down and look to see if ‘Stamina’ is shown as a page or not. If not, press ‘Add New’.
  6. You should find ‘Stamina’ in the options, and add it.
  7. The Garmin head unit will then offer you ways to slide the ‘Stamina’ page around in order, until it’s where you want it. As a Lefty, I tend to swipe Left-to-Right, so mine is Second-from-Last.
Garmin Stamina Page Procedure
I call the ‘Settings’ button the ‘Sandwich’ button because it looks like two slices of bread with a thin slice of ham in between!


Garmin Stamina Settings Page 2
Once you’ve clicked on the Sandwich button, you’ll see this page. Tap the ‘Activity Profiles’ button.


Garmin Stamina Page 3
Go to the Profile where you want to add a Stamina Screen.


Garmin Stamina Click on 'Data Screens'
Click on ‘Data Screens’


'Stamina' Will be near the bottom of the list.
‘Stamina’ Will be near the bottom of the list.


Garmin Stamina Reorder Option
Slide the Stamina Page around in order so you can swipe to it or in the case of the 540, you can use the buttons to slide the pages around.

Back-Arrow out until you get to the main screen, and then tap on the Profile itself. Swipe until the screen shows up.

Garmin Stamina and Stamina Potential Page
What you end up with is a page that looks like this.

There are 3 Fields, including a Stamina Bar with Stamina and Stamina Potential in numbers, followed by a Wattage Graph, and finally, a traditional Heart Rate Graph. Above the Stamina Bar is an ‘Estimated Distance’ value, and it makes me wonder if that might not be useful for an Ultra-Cycling event. Hmmm.

How to Use Garmin Stamina and Stamina Potential

Garmin Stamina Stamina Potential 60-60s
I’m purposely avoiding revealing the wattage and heart rate values on this chart, because I honestly believe I couldn’t go any harder, or get Stamina down below 0%. These were Billat 60-60’s, and you can see that I drove the Garmin Stamina Potential down significantly as well.

Remember the ground rules:

  • Once you start a ride file, Stamina and Stamina Potential will begin to decay.
  • The rate of decay is dependent upon time spent at different intensities.
  • At low intensities, Garmin Stamina and Stamina Potential will decay at the same rate. If you ride at a higher intensity, the Garmin Stamina value will drop faster than the Garmin Stamina Potential value.
  • Garmin Stamina can rebound, but it will never be higher than Garmin Stamina Potential.
  • “500 watts after 600 KiloJoules is harder than 500 watt after 200 KiloJoules!”

A 20-Minute Effort With Stamina and Stamina Potential

I’ve been using Garmin Stamina and Stamina Potential for a couple of months now, especially in my Indoor Virtual Studio over at VQ Velocity. We recently rode some ubiquitous 2 x 20 minute efforts right at or just above Threshold. Here are the results of the first interval.

20 Minute Garmin Stamina and Stamina Potential Chart Interval 1
While I was not paying complete attention to this metric, I was watching it out of the corner of my eye.


I’ll crowd the chart a bit, to show some other physiological metrics, just so you can see how ‘hard’ this interval really was.

20 Minute Garmin Stamina and Stamina Potential Chart Interval 1 Chart 2 with SmO2
Garmin Stamina and Stamina Potential seem to be pulling from a combo of heart rate variability, wattage, and maybe respiratory rate. I added the SmO2 values from Moxy to show that I actually was at my physiological threshold, which was ABOVE the threshold value provided by Garmin (and other metric platforms, btw….). See my previous blog about SmO2 Tipping Points, and Borrowed Time.

On-Screen, the Page looked like this…


Garmin Stamina Stamina Potential 20 Minute Effort
Stamina will decrease faster than Stamina Potential when you’re riding over your Threshold. Stamina Potential is a little slower, but I’m finding that it definitely helps me gauge my effort on work, especially later in a ride.

Look carefully at the Red, Black, and Clear Line. You’ll see an ‘arrow’ where the red meets the black. This is the point where the Garmin Stamina is declining faster than the Garmin Potential Stamina. Red means decline. Green means recovery. Potential will NOT recover during a ride. It may plateau, but it won’t rebound.

For context, here’s the graph of the SECOND 20-minute interval……

Second 20-minute Interval Garmin Stamina Stamina Potential
Physiologically, I got some training effect out of this effort, but had I followed the physics and tried to hold the same power that I had held in the first interval, I would have blown up. Stamina at 3% is an indicator that you’re ON BORROWED TIME. When Stamina and Stamina Potential are BOTH pretty low, you’re cooked, and it’s time to go home.

Billat 60-60s With Stamina and Stamina Potential.

Garmin Stamina Stamina Potential 60-60s With Comments
The 60-second interval intensity for these efforts was roughly 350-375 watts. Watching Stamina and Potential, I was able to gauge just how much I had left in the tank, before exhaustion.


Above is the post-ride overview of a set of Billat 60-second intervals with 60-second recoveries. Notice how Garmin Stamina pulls Stamina Potential down over the course of the ride.

Here’s what the ride looked like on my Garmin 1040.

Garmin Stamina and Stamina Potential Early In an Interval Set
This was Interval #7. Stamina is now in the gutter, but I still have some Potential left, so let’s keep going. 


Garmin Stamina Billat 60-60s Interval 11
11 Intervals in, and Stamina hovered between 15 and 3%. Stamina Potential dropped about 2 points per 60-second effort.


Garmin and Garmin Potential Screen 60-60 Intervals Last Effort
This was my last interval before calling it a morning. The Stamina got down to about 2% in the interval before, but I was unable to perform it for the full 60-seconds, and Stamina rebounded artificially high. While this last interval was high quality at 374 watts, Stamina only came down to 8%, while Stamina Potential reached its’ lowest level, at 24%. I was definitely fatigued.

For context, here is a link to the ride itself on Garmin Connect…


And here is an image of what Garmin gave this ride, in terms of Aerobic TE, Anaerobic TE, EPOC, and Training Effect.

Garmin Stamina Stamina Potential Workout Summary With EPOC Aerobic Anaerobic TE Scores
While I’m ignoring the ‘Tempo’ summary, this was a highly effective Aerobic and Anaerobic Workout that took days from which to recover.

Pay Attention to Garmin Stamina and Stamina Potential

Garmin has been at this game of product development now for about two decades. They bought a company (FirstBeat) with even deeper roots and history. They’re an Aviation company, a sport metrics company, and a travel logistics company. But they’re really onto something here. These developments use a history of science, a slightly conservative approach, but one that is loading features into rugged devices, and then helping recreational athletes improve their fitness in a holistic way. That’s what’s so fascinating about the Garmin Ecosystem. Their motto is, “Beat Yesterday.” And as both a coach and an athlete, using features like Garmin Stamina and Stamina Potential, I am.

Functional Threshold Power Chart Garmin Stamina and Stamina Potential
Something must be working….. The tools are all here at OBC and Garmin Connect.

I’ll post later about the possibilities of BREAKING this fatigue model, and how the model later adapts, but it’s really rare.

Thanks for reading, and ENJOY THE RIDE!

Share this:

  • Click to share on Facebook (Opens in new window) Facebook
  • Click to share on X (Opens in new window) X

Like this:

Like Loading...

Written by Richard Wharton · Categorized: Garmin Connect, Garmin Fields, Uncategorized · Tagged: Bike Coach, Cycling Coach, Garmin, Garmin connect, Garmin Cycling, Garmin Stamina, Garmin Stamina Potential

May 05 2023

ShockWiz And Segments At Lake Pueblo State Park

ShockWiz Suspension Tuning at a New Venue!

(*****NOTE: This post was originally created in October of 2022, but was never published. I still believe, however, that there’s a lot of relevant information we can glean from the ShockWiz Suspension Tuning System, and I’m going to continue this thread while I wait for the trails to dry out in Northern California.). 

Richard and Tracy Wharton at Lake Pueblo State Park
This image was taken at the end of the “Outer Loop NB” segment at Lake Pueblo State Park. I’m using the ShockWiz Suspension Tuning System to optimize my suspension for this series of flat, shale, twisty trails.

Since moving to Pueblo, CO at the end of September, I have been studying the ShockWiz Suspension results on rides at Lake Pueblo State Park. The Park is located about 4 miles from the home where we are staying, and the trip is no more than ten minutes. Pueblo State Park has over 80 miles of accessible singletrack and paved trails. The trails are maintained by the Southern Colorado Trail Builders, and they’re a good mix of flow, climbing in and out of drainages, and some great, twisty singletrack. While the area is vertically challenged, it makes up for this with banked berms, narrow trail, and beautiful views. The trail is almost exclusively broken shale over dirt, so it’s fast in some places, and loose scree in others, especially in the hairpins. The area is exposed, so bring sunscreen and plenty of water!


Different Geography, Different Results

Lake Pueblo State Park Trails
Lake Pueblo State Park is just 5 miles from the house where we are temporarily staying. There’s a great network of trails there, with plenty of challenges.

In a previous post, I wrote about tuning the suspension on my Intense Sniper T Pro while riding the same trails from my home on Peavine Mountain, in Northern Nevada. I’m doing the same thing here; I am completely focused on my suspension results of one particular segment of Lake Pueblo State Park – the “Outer Loop NB (Northbound)”.  I have ridden this segment six times so far, and I’ve used the data from the ShockWiz App on this timed segment to make adjustments to both the front and rear suspension.

With the Peavine trails, it took about 20-23 rides to get the ShockWiz suspension values to consistently read in the 90’s. I also paid to get the rear suspension tuned by Mike Davis at MAD Suspension. I’m now on Ride #8 down here, and I just earned two 96 Point Results on the Suspension! Furthermore, I earned FOUR Segment PR’s, including Outer Loop NB!

First Ride – Establishing a Baseline With Shockwiz

Given the terrain, it’s not easy to get a 99-100% Confidence Interval. 
ShockWiz Ride 1 Rear Results
You can never expect ride results from two completely different geographic areas to be the same. ShockWiz is telling me that Tuning and Optimization are trail-specific, geology-specific, maybe even ride intensity and goal specific.


First off, a couple of notes.

  • I’m not fit. I was getting fit earlier in the Fall, and I’ll write another blog post updating my study of Garmin’s EPOC and Aerobic Training Effect system, as well as the DFAA-1 heart rate system. Then we packed to move to Pueblo, and I lost a good chunk of that fitness. I HAVE been getting fit again since I arrived in Pueblo, however, and all of it has been based on Mountain Biking.
  • Mountain Biking here is… different. It’s non vertical. It’s not as twisty as the singletrack I rode in Texas, but it’s more twisty than the riding out in Northern Nevada. It’s much more a full-body workout.
  • I’m STILL getting numb hands. I recently but my bars down to 740mm and it helped, but it’s now an inconsistent numbness. I’m experimenting with my shifters and brakes at different positions and angles, and I hope that will help.
  • There’s less need for rear suspension on these trails, so I MAY alter the compression dial from ‘Open’ to ‘Semi-Open’.
  • I cannot alter the shock and suspension with revalving or different oils. I’m just not going to do that.

But let’s stick to the theme of learning. Here are the suggestions from the ShockWiz App, post-ride.

ShockWiz Post-Ride Analysis

Let’s start with the Rear Suspension first, since I’m basing that on my work with Mike from MAD over the years. He always argued that the Rear should be tuned first. So, let’s go.

Shockwiz Rear Recommendations Pueblo State Park
The results of this ride resulted in a Shockwiz Score of 84 points, with 100% confidence.
Shockwiz Rear Suspension Recommendations Pueblo State Park Ride 1.
Rear Rebound and Compression were in need of tuning the most. I think I can alter the Compression for better comfort and control on this chippy rock.
Shockwiz Post Ride Rear Suspension Recommendations Pueblo Colorado State Park.
Everything looks good here…..
Shockwiz Rear Suspension Dynamic Sag Detection Pueblo State Park.
I’m ALWAYS trying to get Dynamic Sag to about 25%, and the ONLY way to do that is with more air. More air, however, mucks with compression and rebound ratios. I’m not sure what I’ll do here.


And let’s see what the Fox Front Looks like.

Shockwiz Pueblo Front Post Ride Analysis Overview Pueblo State Park.
The ShockWiz wanted me to head out and get some more data, but I was running out of time. I got an 82 out of 100. Let’s see what the recommendations are…
Shockwiz Front Fork Suggestions Page 1 Pueblo State Park.
OUCH. Less air, more spacers, softer compression. Honestly, I think I’m going to get a few more rides in before changing this too much.
Shockwiz Front Fork recommendations Ride 1 Pueblo State Park.
I think this shows that despite the previous screen, where the recommendations were all over the place, by and large, the settings I have on the fork DO work. Same with the rear information above.
Shockwiz Front Fork Statistics page highlighting dynamic sag.
OKay, just a reminder. I am NOT a hotdog. I don’t get ‘Big Air’, and I’m not ‘Sending it’ off a cliff or anything. If it happens, it happens, but I’m more interested in dynamic sag. In this case, I’m actually okay with 10% sag.


CONCLUSION – Shockwiz Probably Needs More Data

Okay – I think the first thing I need is MORE DATA. I want to figure out the TREND. The suspension is working, but there are definitely ways I could be tweaking the dials and valves to get more.

I’ll write up another post later, once I have more data from the dirt.

Thanks for reading, and ENJOY THE RIDE!


Share this:

  • Click to share on Facebook (Opens in new window) Facebook
  • Click to share on X (Opens in new window) X

Like this:

Like Loading...

Written by Richard Wharton · Categorized: Mountain Biking, ShockWiz, Uncategorized · Tagged: mountain bike coach, mountain biking, Mountain Biking Pueblo State Park, ShockWiz

Feb 22 2023

2023: New Home, New Goals, New Services, New Discussions

New Home: Sacramento, California, USA!

New OBC Headquarters
New OBC Headquarters – complete with Wild Turkey!

Hey everyone, I can’t believe that I’ve landed and set up shop in our new home here in Sacramento, California. Honestly, I haven’t been a Californian since 1974, so this is definitely going to be a new experience.

Online Bike Coach has been a stalwart pillar of coaching and information since its’ inception in 2003. I’ve been coaching cyclists since 1993, so this is my 30th Anniversary as a Cycling Coach! While we’ve learned, taught, and experienced many things, it’s time to reset the foundations and make the NEXT 15 years even stronger.

New Goals

New OBC Logo White PCThe Goals for Online Bike Coach going forward are simple: Offering cycling-based training classes and programs for fitness, health, longevity and performance. To do this, I am going to migrate what was a successful 15 years of In-Studio training, over to online Group Classes, via www.vqvelocity.com. Online Bike Coach will offer LIVE and RECORDED classes, multiple days of the week, with different goals and agendas. We’ll work on the FUNDAMENTALS; Aerobic Fitness, Anaerobic Work Capacity, Stamina, Strength, and Speed. You can take as many classes as you wish, pop in here and there for a quickie, or replay any one of the rides in the library as it grows. Classes will be held in the Pacific Time Zone, but I’ll be posting hours that fit client needs across the four major time zones in the US, and will consider time zones in Europe and Australia as well if there is demand.

Traditional Coaching will also continue, but I’ll be increasing the hybrid approach of using the most recent cardio-vascular technology and assessment information via Garmin head units and wristwatches for Aerobic Conditioning. For those who subscribe to the ‘Polarized Training’ approach (and I use both Polarized and SweetSpot methods, depending on each rider’s needs or time availability), the latest ‘Stamina‘ Feature from Garmin, and other metrics for supra-threshold and vo2 that I’ve reviewed and used before.

We want time-tested, scientifically validated metrics, but I still fear that most producers are not interested in advancing known science, but are instead focused on profit. I refuse to be a Tent Preacher, and will emphasize known, published science where I can. Where I cannot, I’ll do the scientific studies using my own instruments, and will publish the results here and elsewhere if I can.

New Discussions

The New Discussions are not necessarily new, but they’re worth a refresh in this blog, on YouTube, and in the general public domain. I intend to blog regularly about the following:

New Hand Signals

  • Cyclist Safety. Cycling is a safe sport. Reat that ad infinitum. CYCLING IS A SAFE SPORT. There are ways you can ride and present yourself in urban and rural settings that will increase your safety, confidence, and competence when out on the road. There’s also technology that can improve your awareness and visibility. Beyond a few one-and-done videos, I intend to produce blogs and videos that show long-term work on these concepts, products and methods. For me, it’s the only way to save the sport from being an indoor-only, virtual-ride product.
  • Training With Technology. I’ve always been a fan of Science and Technology, and cycling is the perfect meld of physics, physiology, and electronic tools of observation and analysis. But there seems to be an information overload, a plethora of features, and not much explanation or distillation of the information provided. I intend to change that, with more regular posts.
  • Garmin Connect Features. Garmin Connect is the data-collection site for so many of the metrics I have mentioned above. However, I’ve searched high and low on the internet to try and find a coach who actually uses these metrics on a regular basis, to COACH an athlete. I also see the semi-artificial intelligence programs found in Garmin Connect, and I wonder about their effectiveness. Some posts on Reddit have been all I’ve seen. The results seem to be all over the place. It makes me wonder if there might not be a better way to look at the metrics provided, and then use that information to better judge and guide fitness training. We’ll see.

I have been coaching now for thirty years; a lot has changed. A lot has not. One historian of cycling said that in the history of humanity, cycling is arguably the only activity that EVOLVED into Recreation, then Utility. It spawned the Tire Industry (Dunlop), which further altered civilization. I think we need to reconnect the social benefits of cycling with 21st century mobility and mental health.

https://youtu.be/ZYwhvD2-fYw

CONCLUSION

The Cycling world has gone ‘U’ shaped; we’ve got people in a really poor demographic using bicycles for utility, and we’ve got really rich people using bicycles for recreation. The Middle Class and cycling have largely disappeared. For example, how many of you readers rode your bikes to school? How many of you have children that ride their bikes to school? How many of you have grandchildren that ride their bikes to school? It’s a vexing question, and I’d like to look into the perceived problems and factual solutions.

That’s really about it for now. I’m going to get on with the day, and I’ll start posting more work, more regularly, going forward. I know I’ve promised that before, but I have the venue, the time, and the desire to pursue this.

Thanks for reading, and ENJOY THE RIDE.

Share this:

  • Click to share on Facebook (Opens in new window) Facebook
  • Click to share on X (Opens in new window) X

Like this:

Like Loading...

Written by Richard Wharton · Categorized: Garmin Connect, news, Uncategorized · Tagged: bicycle coach, Bike Coach, Cycling Coach, Garmin connect, Wattage Training

  • 1
  • 2
  • 3
  • …
  • 6
  • Next Page »
  • Shop
  • Contact Us
  • What we do.
  • How we do it.
  • Why it works.
  • Who we are.
  • What you’ll need.
  • Let’s get started.
  • Blog
  • My account

Copyright © 2025 — Online Bike Coach • All rights reserved.

info@onlinebikecoach.com   |   (1) 214-616-9850   |     |  

  • Shop
  • Contact Us
  • What we do.
  • How we do it.
  • Why it works.
  • Who we are.
  • What you’ll need.
  • Let’s get started.
  • Blog
  • My account
%d