Online Bike Coach

Where Cyclists and Triathletes get Faster/Stronger/Leaner/Sooner

  • Shop
  • Contact Us
  • What we do.
  • How we do it.
  • Why it works.
  • Who we are.
  • What you’ll need.
  • Let’s get started.
  • Blog
  • My account

Apr 09 2025

Vo2Max and Heart Health – A Single Ride Following Dr. Paddy Barrett’s Formula

Vo2Max and Heart Health Correlation With DFAA-1 and other Metrics

DFAA1 and SmO2
When we flip the script on wattage, and instead focus on heart health, we have a host of new metrics we can observe and track to ensure compliance.

I recently stumbled across a Substack post by Dr. Paddy Barrett that explains how Vo2Max is impacted by low intensity exercise. While I had not known about Dr. Barrett previously, when I read his history and other posts, I became intrigued. I think he’s a world-renowned Cardiologist who focuses on heart health, and his posts discuss exercise, diets, supplements and lifestyle recommendations. In a way, I’m reminded of Dr. Ken Cooper of the Aerobics Institute, but Dr. Barrett is about half Dr. Cooper’s age.

The article I am referencing for this post discusses Vo2max, and ways to raise that value. But Dr. Barrett makes a unique argument. The article states that there are ways to RAISE Vo2max, but there is a different way to obtain your HIGHEST Vo2Max. They’re different things. Honestly, I had never thought of Vo2Max in this way, so I dug deeper.

Raising Vo2Max Is All About INTERVALS

Vo2max and SmO2 Intervals
The area in black is a rolling 30-second view of my Vo2max, per the Vo2 Master. The area in red is my saturated muscle oxygen on my left lateralis. The goal is to find something we can use in the field, to equivocate with the data I acquire in the lab.

Intervals. Boy, do I know a lot about intervals. Short-Sharp, Medium-Hard, Tabata, Zonneveld, 2×20’s, Fibonacci’s, Reverse-Fibonacci’s. I know Intervals. Intervals are hard. They strain the cardio-vascular system. They FEEL like results. Intervals are NOT boring.

Intervals, especially intervals that are inside of, say, six minutes in duration, will improve Vo2Max over time. I routinely perform six-to-eight-week blocks of Vo2Max efforts to raise not just my Threshold for economy (another metric that benefits from Vo2Max intervals), but also my ability to perform in the Supra-Threshold Realm. This level of intensity creates a massive bath of lactate, and requires a LOT of MCT1’s and MCT4’s (Monocarboxylate Transporters) to convert that lactate back into energy. Vo2Max efforts build those MCT1’s and 4’s, and they grow the muscles of the heart as well.

Vo2Max Intervals will raise Vo2Max… relative to an original value…

But not two sentences later, Dr. Barrett talks about the ‘Other’ component of Vo2Max; the highest overall value a cyclist can obtain. So intervals improve Vo2Max, but they don’t necessarily help you achieve your highest possible overall value.

Achieving Your HIGHEST FEASIBLE Vo2Max… Is All About BASE TRAINING!

Base. I write about it. I try to achieve it with AlphaHRV and DFAA-1, both for myself and my clients. I use a Moxy Monitor to observe muscle oxygen percentages that correspond with Ventilatory Threshold 1 and Ventilatory Threshold 2. We also study basic, old-fashioned heart rate, and of course, power/watts.

Dr. Cooper called it ‘LSD’, for Long, Steady Distance. The popular term these days is ‘Zone 2’. It’s an intensity that is assertive, but not overly so. It’s aerobic. It relies on fat for the majority of the fuel that is used.

But Dr. Barrett has one comment in the article that stands out…

“Stroke volume and left ventricular dilation are at their maximum between 40 – 60% of V02 Max 6.

Above 60% of V02 Max, stroke volume decreases, and the heart does not reach its full dilation capacity (LVEDD).

For most people, 40 to 60% of V02 Max is a relatively low intensity.

Usually a good big serving of Zone 1 and some Zone 2.

As you train these zones, your resting heart rate will decrease.

Therefore, for each heartbeat, your heart will fill even more, and the heart will dilate even more.

This intensity is where most people should be spending most of their time.”

And it’s the BOLD part that really struck me.

I can actually measure 40-60% of Vo2Max on my Vo2Master. Furthermore, I’ll pair that metric with traditional heart rate, DFAA-1, Muscle Oxygen, Power, and even cadence, to assess just what those values are in relation to that Vo2Max range. It’s a study of N=1, with a workout count of N=1, but if the numbers correlate with my own observations from previous rides, then it’s an affirmation that all my geek measurements are actually valid… at least for me.

Let’s Take A Ride.

On January 5th, 2025, I rode a ‘Base’ ride with my clients on VQ Velocity. I used the Vo2Master mask, a Moxy Monitor, the AlphaHRV Field on a Garmin 1040, and a power meter.

You can find this ride and others in an app that a client, Kenneth O’Brien, built for me so that we could assess this information in this way.

JUST CLICK HERE.

For this ride, the file in the drop-down menu reads ‘RW-01-05-25-drp-protocol‘.

I used the mask for about 28 minutes of the effort. The mask was calibrated with a 3 liter plunger, and was calibrated for O2.

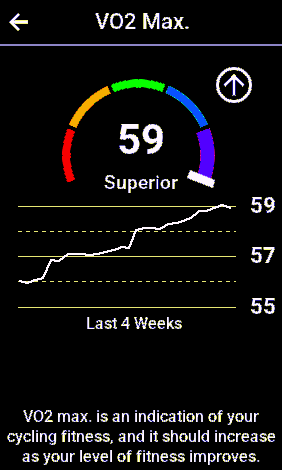
Based on efforts in late December, I am highly confident that my Vo2Max (IN INTERVALS….!) is about 60ml/kg/min (See the file dated ‘RW-12-22-24’ in the app).

40% of 60ml/kg/min = 24

60% of 60ml/kg/min = 36

For the Best twenty minutes of this ride, here are my averages…

Coach Richard Wharton Base Ride Vo2 Values
Here’s the information from the file, using Vo2 as the max average basis. Based on a previous post, I believe my VT1 Threshold for traditional heart rate is about 140 bpm. Alpha 1 is usually higher than 1.11 at 136. This is the first indicator that Dr. Barrett’s referral to 40-60% of Vo2max is spot on.

This next image changes the ‘Max Average Basis’ to traditional heart rate, which just serves to shuffle the columns a bit, to make it easier to see the data.

Richard Wharton Vo2Master Paddy Barrett Zone 1 Zone 2
Vo2 stayed right at or below the 60% value, while heart rate and power were solidly in my perceived aerobic zone of intensity.

Now – let’s look at DFAA-1 via AlphaHRV:

If you read through this blog post from November of 2024, you’ll see that the values on the charts above are very similar to the charts and averages from two months earlier.

  • VO2 for that base ride was 38ml/kg/min. That checks with the 40ml/kg/min upper limit.
  • Average heart rate was 136 beats per minute. This is the same.
  • Average power was 170 watts in November, and 166 watts in January. This is VERY similar.
  • DFAA-1 averaged 1.34 in November, and it averaged 1.19 for this ride. Both values are above my stated goal of 1.10 or even 1.15.
Average AlphaHRV value 20min dfaa-1
Alpha 1, calculated by AlphaHRV app on the Garmin head unit, has me at a 1.19. Anything above a 1.10 or 1.15 for me, is Aerobic.


CONCLUSION

Dr. Paddy Barrett’s article states that the heart chambers will dilate more fully at an intensity between 40 and 60% of Vo2max. However, it’s hard to get Vo2 values because of the cost of the equipment.

Therefore, we need to determine whether other methods of physiological tracking are equally valid.

  1. Vo2 for the effort was just under 60%. CHECK.
  2. Traditional Heart Rate was below 140bpm, which an earlier blog post determined was the upper limit of my VT1 breakpoint. CHECK.
  3. AlphaHRV recorded an average DFAA-1 at 1.19, which is above the 1.10-1.15 value that I have determined is the equivalent breakpoint for Threshold 1. CHECK.
  4. Traditional wattage was about 170 watts, give or take. This is below my self-prescribed Threshold 1 as well. CHECK.

I think we can safely affirm that the combination of using AlphaHRV, Traditional Heart Rate, and maybe a rolling 30-second view of wattage, will give us a high level of confidence that we are safely and effectively cycling to improve Vo2Max. Following AlphaHRV values allows my athletes to ride for the most effective value OF THAT DAY. This eliminates Physics (wattage), and emphasizes recovery, hydration, fatigue, temperature, and more. Let’s go with the Physiological parameters for accuracy; we can worry about performance later.

Thanks for reading, and

#ENJOY THE RIDE!


Share this:

  • Click to share on Facebook (Opens in new window) Facebook
  • Click to share on X (Opens in new window) X

Like this:

Like Loading...

Written by Richard Wharton · Categorized: DFAA1, Moxy, Vo2 Master · Tagged: Bike Coach, Cycling Coach, DFAa-1, mountain bike coach, Moxy, Peavine, Reno Cycling Coach, Reno Mountain Biking, Richard Wharton, Vo2 Max, vo2master, Vo2max, Zone 2

Jan 26 2025

The OBC Dicta

The OBC Dicta (or, The Nine Commandments for Peak Performance In Cycling).

*** I wrote the first version of this over twenty years ago, hoping that it would become the foundation for another book, but life and acceleration got in the way, and I just found it again in my Google Drive.

A ‘Dicta‘ is defined as a series of statements that are sort-of Universally Accepted Comments or Commandments. The following Principles are nothing new, but they need to be plastered on a wall or a screen somewhere, frequently, to remind you of the ‘why’ behind the ‘what’ that we are doing at Online Bike Coach.

(By the way – the whole ‘Dicta’ theme is something I got from my interest in fighter aviation and history. It’s based on an early pioneer in fighter aviation and tactics, Oswald Boelke.

So in their entirety, and updated for relevance, I present my updated ‘OBC Dicta‘.

OBC Dicta #1: IMPROVE YOUR RELATIVE VO2 MAX (rVo2Max).

Garmin Vo2Max 1040
The type of work you do when cycling dictates the gains and losses of Vo2Max. The Garmin algorithm seems to track FAIRLY WELL for me, against the Vo2master gas exchange analyzer. ***What you don’t see in this chart is the subsequent DECLINE in VO2max in the following four weeks. Vo2max needs to rise and fall like a seasonal tide. As I write this, I’m at about 53ml/kg/min, but it’s January, and I’m working my way back up for spring.

Vo2max translated means “Maximal Volume of Oxygen Absorption”. When you study the number in a laboratory setting, it is translated into “milliliters of oxygen, per kilogram of body weight, per minute” (w/kg/min). So, it’s based on absorption of oxygen, weight, and time. When we perform intervals that are hard as heck, and last maybe 2 to 6 minutes, total, we’re working on optimizing rVo2max.

When you improve your ability to process oxygen, you actually improve your ability to create energy at the cellular level, and thus ride stronger and faster with the same, or even less effort. If you’re like most of us, and you need to lose a few pounds, well, that’ll only help. W/Kg Babeee!

OBC Dicta #2: Raise Your Wattage at Lactate Threshold (wLT), VT2 (Ventilatory Threshold Breakpoint 2), or Functional Threshold/Critical Power, to the highest feasible value, relative to body weight.

Garmin Connect FTP Chart
The way I describe FTP is as such: It’s the power and cardiovascular output, ABOVE WHICH, you are on ‘Borrowed Time’. This can be measured in minutes and seconds. BELOW this value, you can ride much longer. Raise this value through proper training and consistency. Your speed and stamina will improve significantly.

Raising your ability to generate power at Threshold does wonders for your body’s economy, not to mention increasing your ability to ride faster BELOW threshold, for longer periods of time. The old-school method of wLT training was to perform longer intervals, but, surprise!

Shorter, more intense intervals at wattage levels ABOVE Lactate Threshold generate these little molecules call “Monocarboxylate Transporters” – let’s just call them “MCT’s”. More MCT’s in the muscle cells allow your body to purge Lactic Acid from the muscles and into the bloodstream, where it is processed into other forms of useable energy.

How to make more MCT’s? Shorter, more intense intervals (about 2 minutes), with longer periods of recovery in between, about 4 minutes of just glass-pedaling.

OBC Dicta #3: Become as economical a cyclist as possible.

OBC Dicta Base Ride
Under Dr. Bruce Rogers‘ guidance, OBC Clients have had a lot of success with Luisma Gallego’s AlphaHRV Field on Garmin bike computers. Keeping Alpha1 ABOVE a certain value provides assurances that the heart is working efficiently, and you’re thus improving your economy. Do rides like THIS…

No, this doesn’t mean that you have to trade in your LandCruiser for a Hybrid Escape! What it does mean is that you want to save every KiloJoule of energy as possible. By ‘banking’ the KiloJoules, you’ll be ready when the action begins! How to increase your economy?

VOLUME.

OBC Dicta #3 Big Picture
…to get Volume that looks like THIS.

Let’s face it. Time spent on the bike is important, and there IS an aerobic benefit from Long Rides. Your support muscles learn how to suspend your body more efficiently, your legs learn when to pedal and when to coast, and your heart adapts to sustained effort by  growing stronger and more efficient, so that you get more out of every stroke. If you’re a serious cyclist in any of the 3 major disciplines (Road, Track, MTB), you’ll make an effort to perform sustained rides, or try to hit at least 6 hours a week riding “base”. That’s an hour a day, 6 days a week.

Got a job? Try 1 hour every other day, and make up the difference on the weekends. THEN, work on Dicta #1 & #2…

OBC Dicta #4: Recover Nutritionally, Hygienically, Physically, Psychologically, and Spiritually as quickly as possible after every ride.

OBC Dicta: Tracy Recovering with Maple
My first coach, Micah McKee, taught me, “Why stand when you can sit, why sit when you can lie down.” Here’s my wife, recovering with a compression apparatus and our younger Pibble, Maple.

Training can be hell on your body, mind, and spirit. It creates trauma, and the best way to minimize the trauma is through a protocol like this:

              • Drink a nutrient and calorie-dense Sports Nutrition Drink within 15 minutes of the end of your workout.
                This will help you recover more quickly, and move your body towards better adaptation to the loads you have
                just placed it under.
              • Shower off, towel off, hose off, scrub yourself down, brush your teeth, and then get back in to your ‘street’
                clothes. You’ll feel refreshed, minimize decay on your teeth, and you’ll either warm up or cool o, depending
                on your needs. You’ll also be dry, which will require less energy to keep warm.
              • Stretch or practice self-massage after every ride. It’ll help the recovery process, and un-knot those muscles
                you’ve been using so heavily. A regular massage from a professional can also enhance recovery and improve
                performance.

OBC Dicta #5: Blog the Process.


(Click on the image to get a look at my Notes for this ride…)

This has never been easier; Garmin Connect, Ride With GPS, Strava, and tons of others all have areas for post-ride comments. Upload photos, upload screenshots, link to videos, link friends who rode with you or know the route or the ride, and give yourself at least SIX SENTENCES to review the effort and reflect. You’ll appreciate flipping through those notes, I assure you. Use the hours after a ride to comment, reflect, inflect, and project your goals, attitude, highlights, and low points. You may be able to detect trends, which can then be addressed and strengthened or corrected.

OBC Dicta #6: Maintain Strong Bones and Muscles Through Consistent Resistance Training.

Tracy Christenson Resistance Training Book Cover
Shameless Plug; my wife wrote a book about using suspension straps and body weight, to improve fitness for cyclists. It’s cheap, it’s thorough, and it just takes a few minutes every other day.

There is no doubt that we, as endurance athletes, need resistance training to augment our aerobic conditioning. Why? Well, here’s one reason: Research has shown that cyclists tend to be built like birds. We’re prone to osteopenia and osteoporosis on the bones that lay ABOVE the hips, while the bones from the hips down tend to be MORE dense than the average population.

Also, one of the major reasons that cyclists tend to have lower bone densities is that we have the potential to use the calcium in our bones to augment our need for calcium in the muscles, thus robbing Peter to pay Paul. Resistance training, with proper loads and nutrition, will help offset that leaching. Furthermore, training the muscles to re in certain ways will definitely help you increase your performance on the bike. Lastly, it’s my belief that resistance training can help offset muscle fatigue, especially in the core and upper body.

OBC Dicta #7: Develop Explosive Force

Richard Wharton Gold Sprints
“Gold Sprints” REALLY HURT! At 60 seconds in length, they’re arguably too long, but they push past the 8-12 second mark for ATP-CP, and then they push through the PAINFUL 25-seconds of ANAEROBIA, before finally forcing you to hang on for another 35 seconds. It’s not just that max power that matters – it’s how you handle that power decay over time that leads to a rider ‘staying on’ for another challenger.

Every cycling discipline relies on Explosive Force – from the gate dropping in a BMX race, to dropping the hammer in a road race, to cleaning a section of difficult singletrack when mountain biking. Explosive Force is what helps you make a break happen, bridge to a break, and even sprint to the Finish line. The more explosive the Force, the quicker the acceleration. The longer the Explosive Force, the more you can drop your competition. There’s some methodology behind that sprint to the City Limits Sign, so whether you’re solo or in a group, keep it up, keep trying, and give it your all. It’ll yield great dividends.

OBC Dicta #8: Develop the Endurance and Efficiency that are SPECIFIC to Your Chosen Type of Cycling.

Richard and Ryan Seher Bozeman 2001
This is an older photo with one of my ‘kids’, Ryan Seher, when we did a 100-mile ride from the ‘B’ parking lot in Bozeman, out to Livingston, MT and then back along the Interstate. This was a COMPLETELY AEROBIC EVENT.

Road Rallies and Tours take 1-5 hours. Track races are rarely more than 25 minutes long. XC mountain bike races, even among the pros, are in the 90-minute range, and road races for amateurs are usually in the 1-to-3-hour range. Whatever the length of the ride, the more efficient you are at that distance or duration, AT PACE, the faster you’ll travel, with less effort. Again, this can be done on weekend rides, solo or in groups.

Whatever the distance or duration, economy matters, and the only way to do that is to train at that distance or greater, at a speed that’s compatible with your goals. 100 miles at 16mph is more effective than 60 miles at 19mph. Think about the longest organized ride you may do, and train at tempo wattage or pace for AT LEAST that distance, once or twice a week, maybe more, depending on the season. It also helps to train in environmental conditions that are similar to what you’ll experience out in the real world.

OBC Dicta #9: Train Both ALONE and IN GROUPS to Optimize Your Cycling Social Fitness, Your Cycling Mental Fitness, and Your Cycling Physical Fitness.

While a majority of your rides may be solo efforts, just due to work or family conflicts, it’s crucial to remember that cycling is a social sport, and on some levels, it’s a team sport. There are some things you just can’t learn alone in a parking lot, so use group rides to learn the nuanced, indescribable, yet crucial skills that are necessary to safe, effective rides in groups. All that efficiency will fall apart if you end up using your muscles to tense up, lock your jaw and neck, and pretend that you’re in the middle of a group of 18-wheelers bent on your imminent demise.

Find a group that meets your level of fitness and comfort, explain who you are and what you’re trying to accomplish, and ask for HELP. Furthermore, make sure you COMMUNICATE YOUR INTENTIONS. Letting others know where you’re going, what you’re doing, and how you’re doing it will make THEM more comfortable with YOU and will help everyone enjoy the ride more. Lastly, don’t let words or barbs at you, your riding skill level, or your equipment, translate into distraction or lost opportunity. If someone calls you a “squirrel”, ask that person for suggestions on how to avoid the title. It’ll either shut them up or atter them, and you’ll get the help you need. It won’t take long before YOU are the one dishing out the advice or making suggestions.

CONCLUSION

OBC Dicta - Welcome to the Cathedral of Watts
The main thing to take away from this image is this; when you follow the Dicta, you WILL see success. This image is on a Micro scale. The blog post is on a Macro scale. Be consistent, stay focused, be Holistic, and watch what happens.

I’m going to end with a poster that disappeared when I sold Cycling Center Dallas. However, it’s still relevant to this day. I’ve certainly mellowed over time, but the main takeaway is this; becoming a better cyclist takes YEARS. My friend, Craig Fulk, taught me the Parable of “How Do You Eat An Elephant?” “One Bite At A Time.”

Follow the Dicta, and let me show you where I can help you with that, on a Micro and a Macro Scale, and then…

ENJOY THE RIDE!

Share this:

  • Click to share on Facebook (Opens in new window) Facebook
  • Click to share on X (Opens in new window) X

Like this:

Like Loading...

Written by Richard Wharton · Categorized: Garmin Connect, Mountain Biking, Road Cycling · Tagged: bicycling, cycling, Cycling Coach, cycling fitness, Garmin connect, Reno Cycling, Reno Cycling Coach

Dec 17 2024

The Physiological Perspective of Four Separate 8-Minute Intervals

8-Minute Intervals At “Threshold”…

4x8 minute intervals online bike coach richard wharton coach wharton garmin connect
Wattage, heart rate, and Saturated Muscle Oxygen do not always agree. In this blog post, I dive into the physiology of EACH INTERVAL, which gives me greater insight into how to improve workouts for myself and you.

In late November of 2024, I was able to perform an interval session on my indoor trainer and bike with my clients. The workout comprised of four separate 8-minute intervals. We used the VQ Velocity app, and I recorded each interval as a separate file while wearing my Vo2Master Gas Exchange Analyzer. Then, one of my clients, Ken O’Brien, actually coded an app that would allow me to compare the intervals against each other.

Traditional Interpretations of 8-Minute Intervals

When I look at the data from a ride file, I usually use graphs and charts from Garmin Connect. When I ride, I use a Garmin 1040 and the lap button, to assess real-time information. For years, I used wattage and traditional heart rate for each of the 8-minute intervals, but with advanced Heart Rate Variability Analysis, I can now include EPOC, aerobic and anaerobic training effect, and DFAA-1. These values USUALLY yield enough information to determine whether I’m achieving my training goals or not.


Inclusion of Gas-Exchange Analysis in 8-Minute Intervals

Vo2Master App Metrics
This is just one page of data fields that I can use on the Vo2Master app. You can also run these fields as graphs. All of the data is stored in a detailed .csv file that can be downloaded and shared for analysis.

By including data from my Vo2Master gas-exchange analyzer, I wanted to determine whether these traditional metrics were accurate and valid. It’s one thing to get a ‘Score’ or an interpretation of training results from a software with algorithms. These are usually pulled from a EULA that traps metadata and makes suppositions about intensity, dose, and recovery. I find these interpretations to be… shallow. Hence, the need to pull data from the body. 8-minute intervals are long enough to measure metabolic changes via data that I can only get from a breath-by-breath analysis. The goal is to MELD traditional, on-bike data that I can get from my Garmin, with the knowledge gained from the Vo2Master, Moxy monitor, and AlphaHRV.

8-Minute Interval Data

Here’s the link to the 4 x 8-minute interval efforts, along with a chart showing ‘traditional’ averages for Garmin Metrics.

And here is my first summary of the information that I collected.

LapAve HRAve CadenceTorque EffectivenessAve PowerSmO2ThB
11689685%24913.645%12.408
21679584%23815.378%12.369
31659185%23216.307%12.364
41689284%22814.434%12.371

This was where I first began to suspect that some of the ‘Traditional’ parameters for an 8-minute interval might not be as effective as decades of efforts had led me to believe. Now – here is the data from the Vo2Master… Let’s first look at Heart Rate vs. Heart Rate.

This is the graphical data for traditional HR, using the First interval as the benchmark, in black. The following intervals are in red.

For those who are interested, THIS LINK will provide access to these files. For this blog post, the files I’m using are found under ‘select dataset directory’, and are the following:

  • ./Data/RW-11-28-24-Int1
  • ./Data/RW-11-28-24-Int2
  • ./Data/RW-11-28-24-Int3
  • ./Data/RW-11-28-24-Int4

You can certainly play with any of the files, however.

Vo2master heart rate vs heart rate chart 1
Heart rate for the first 8-minute interval is in black. Heart rate for the second interval is in red. You can see a similar pattern.

Here’s the chart comparing the first interval to the third 8-minute interval.

o2master heart rate vs heart rate chart 2
Again, once I get set into the effort, traditional heart rate follows a similar path.

For the fourth interval, there was something that interfered with my final 30-seconds, so the effort was cut slightly short. However, for the 6-minutes in the middle, again, traditional heart rate is similar. Refer to the above table to see just how close the heart rate averages were.

Heart Rate vs. Vo2

Now – here’s a table showing traditional on-bike metrics vs. Vo2Master metrics for each 8-minute interval.

LapAverage Vo2Heart RatePower AverageRespiratory RateSmO2ThB
146.531682494013.645%12.408
244.631672383915.378%12.369
341.981652323516.307%12.364
441.171672283714.434%12.371

And here are some charts comparing different metrics from one interval to the next. Again, I’ll use Interval #1 as the benchmark.

Online Bike Coach Vo2Master 8 Minute Intervals Compared n1
This is a Vo2 comparison of my first and second 8-minute Interval. Black is the first interval, red is the second. The averages are on the table above.

Here’s the first interval against the third interval…

Online Bike Coach Vo2Master 8 Minute Intervals Compared n2
Again, the first interval is in black, while the second is in red. I lost Vo2 intensity and efficiency for roughly equivalent heart rate.

And here’s the first interval against the last interval…

Online Bike Coach Vo2Master 8 Minute Intervals Compared n3
And finally – here’s the last of the four 8-minute intervals. Vo2 was suppressed, as was wattage, but heart rate was not.

Vo2 vs. SmO2 for the 8-Minute Intervals…

Now remember – we’re looking at what wearables are telling us, vs. the outcome. These intervals really were NOT that great for me, but if I want to improve both results and consistency for the time requirement and demands, I really want to dig deep and look at all of the parameters. Here, I have placed Vo2 against SmO2 in the Left Lateralis. Take a look….

Online Bike Coach Vo2Master Moxy Monitor 8 Minute Intervals Compared n1
Rember to use the table a few paragraphs up. There, you’ll see my average SmO2 for each interval. In my opinion, I went WAY too hard for most of the intervals, and ended up fatigued out, which affected the other three efforts. Let’s continue…

Here’s 8-minute interval number 2.

Online Bike Coach Vo2Master Moxy Monitor 8 Minute Intervals Compared n2
This interval is unique because you can see how ‘backing off’ on the intensity, lowered my Vo2, and raised my SmO2, right around Minute 4 to 5. I think this is an important value, which I’ll point out in the following image….

I’m going to show 8-minute interval #2 again, this time with wattage instead of Vo2.

Online Bike Coach Moxy vs wattage 8 Minute Interval n2
I love looking at SmO2 from my Moxy, because it’s consistent, sensitive, and is a fair proxy for VT2 and/or LT2. As you can see, when power (Vo2 is in the previous image), drops as a result of less effort, SmO2 rises, allowing me to witness and recover without losing too much power or intensity. When I rally, Smo2 drops again, but I am better able to find a ‘sweet spot’ of intensity that leads to a sort of ‘Plateau’ for saturated muscle oxygen. By the way – the drop in power at the end is from a hard shift that forced me to stand. It messed up the readings. Don’t Do This!

Here’s the third of the 8-minute intervals, comparing Vo2 to Smo2…

Online Bike Coach Vo2Master Moxy Monitor 8 Minute Intervals Compared n3
By the third interval, I had kind of nailed down the intensity that I was going to be able to sustain more appropriately. Vo2 is more consistent, while SmO2 range is also more consistent.

Now, the 4th 8-minute interval was wonky, and if you look at the right side axis, you’ll see that the scaling is off. You’ll need to refer to the tables, but suffice it to say – SmO2 was fairly low, wattage was compromised, and Vo2 was also compromised. My own interpretation is that I was knackered; fatigued; out of sugar; bonking. But honestly, I don’t really have an answer.

Online Bike Coach Vo2Master Moxy Monitor 8 Minute Intervals Compared n4
Not much to say here, other than I believe the SmO2 sensor CAN give a clear picture, on a Garmin head unit, of those liminal states of intensity, below which (higher SmO2 %) you’re safe, and above which (lower % SmO2), you’re on ‘borrowed time’. I pretty much hit the ‘sweet spot’ via Smo2 (demand) at about the 5-minute mark.

Now, here’s the Crux…

If we use some of these ALGORITHMS that claim to ACCURATELY PREDICT Threshold Power, Functional Threshold Power, VT2, LT2, Critical Power, or whatever, then we depend on them for accuracy, consistency, and repeatability.

But when you look at my tables, and then the graphs, this really is not as accurate as one might be led to believe. The two that I have used extensively in the past, which I won’t name, have my ‘Threshold’ at 270 watts, and 172 beats per minute, per traditional heart rate. These interval intensities were nowhere close. Since 2003, when I first began programming interval sessions for clients using WordPad, I’ve always understood that wattage cannot be the end-all, be-all to training. We have to look at things Holistically.

These wearables, like a Moxy and a modern Garmin or Polar Chest strap, along with 3rd-party Fields, like AlphaHRV (which I did NOT discuss in this post, but will in a follow-up), give us a price-effective way to gain greater insight into EVERY ride, EVERY INTERVAL, and even EVERY BREATH or PEDAL STROKE, down to the second.

I’ll post a follow-up to this post, with some more insights, but I’m at my limits of knowledge here. This is where the ‘Mad Scientist’ always loses out. I need a True Physiologist. Luckily, I’ve got two or ten who share my passion for these Deep Dives, and who can help me understand. I’ll share this information as soon as I can.

Thanks for reading, and

#ENJOYTHERIDE!


Share this:

  • Click to share on Facebook (Opens in new window) Facebook
  • Click to share on X (Opens in new window) X

Like this:

Like Loading...

Written by Richard Wharton · Categorized: DFAA1, Fitness, Garmin Connect, Garmin Fields, Moxy, Vo2 Master · Tagged: AlphaHRV, Bike Coach, Cycling Coach, DFAa-1, Garmin connect, mountain bike coach, Moxy, Peavine, Reno Bike Coach, Reno Cycling Coach, vo2master

Nov 20 2024

Rotor Q Rings Revisited – Yet Again

Rotor Q Rings DO Work – Just Not The Way You Might Think

I’ve been using Rotor Q Rings ever since they came out. Prior to that, I was using Rotor’s ‘RSX’ technology, because the company gave their product to trained scientists for honest review and application.

The theory behind Q rings is that they provide gains in power without costs in metabolic energy expenditure. I don’t think that’s exactly the best translation. Instead, I believe that they do two things…

  1. They provide just ‘that much more’ power in the Power Phase of a pedal stroke (it’s 2-6%, and it’s NOT 360 degrees; more like 70-90 degrees)… and…
  2. Based on the ovality (once a thing, now just standardized – no more QXL rings…), Rotor Q Rings can help Optimize the ‘Moment’ (Physics Term) where max torque can lead to those extra millimeters of power and thrust.


Q Rings Have Five Settings

Rotor introduced a method, way back in 2010, I believe, where a cyclist could figure out just where the highest torque occurred in a pedal stroke, in relation to the crankarm. In an ideal world, this torque occurs at the highest ‘Moment’ of a pedal stroke. In other words, if a crank of 170mm was riding at 0% slope, ideally, the “Optimal Moment” would also be at 170mm, at the 3 o’clock position, or 90 degrees, completely perpendicular to the force of gravity. Like a crowbar, a cyclist pushing a crank with their leg gets the best assist from gravity where the crankarm is longest.

But it doesn’t usually work that way.

Pedal strokes and power phases are unique to the individual. You have to look at ‘Moment’. If the Rotor InPower Software shows that your ‘Optimal Moment’ is slightly above or below 90 degrees, well, that’s where the Q Ring can be beneficial. Move the Q Ring to the Optimal Chainring Position, and you’ve Optimized your power output.

Gravity Always Wins – But Torque Helps

When Pablo Carrasco, the inventor of Rotor Products, started looking at the physics of pedaling, he noticed some things.

  1. If a crank and chainring achieve OCP at 0% slope, the value might be different at different slopes.
  2. The contact point where chain and ring meet is always at 0 degrees. But having ‘Optimal Moment’ at 90 degrees at 0% slope in relation to the bike, would have you at ‘Optimal Moment’ of 80degrees (OCP 2) at a 5 or 6^% slope.

The goal for Rotor Q Rings should be to ‘Optimize’ the Chainring for torque based on the slope you want to optimize. If you’re a sprinter, well, the study I remember from Pez Cycling showed that while Max Power was not significantly altered, the rate at which Max Power was achieved was statistically significant. The study also showed that Rotor Positions 4 and 5 (with the crank near 4 0’clock position), was ‘Optimal’. Ironically, ‘Moment’ for a 170 mm crank at 4 o’clock position would be around 150mm, effectively, a shorter crank….

When I used the Rotor InPower system on my Mountain bike earlier this year, the OCP recommendation for a roughly 5% slope was OCP 4. I truly can ‘feel’ the torque on steep climbs, and as I age, I continue to rely on every mechanical advantage I can possibly hold.

Rotor Q Rings On A Road Bike In Hilly or Mountainous Terrain

The Rotor InPower Cranks that I have on my 2018 Cervelo date back to…. 2012??? 2015? I honestly don’t remember. When I raced, the terrain in Texas was rolling, punchy, and finishes were almost always flat or false-flat. I used the InPower software for PC, on rollers, to determine my Optimal Chainring Position (OCP), and came up with a ‘4’. I did not change it for eight years.

This year, upon my return to Reno, and having lost about two years of my outdoor cycling life to, well, life, I focused on my mountain biking. Now that winter has hit, and the trails will soon close, I’ll be riding out on the road more, as well as indoors. I decided to test my road bike, and reset my rings. This was done indoors, since that’s the only way I can ‘read’ the data from these cranks; they don’t

Here are the results:

At 0% slope, the Rotor Optimal Chainring Position (OCP) showed either Position 2 or 3, but from 1% slope up to 5% slope, when I quit the assessment, the InPower Software told me to place my Q Rings at OCP 2.

This MAY SOUND FAMILIAR.

Conclusion

So now I’m set. I’ve moved my Rotor Q Rings to OCP 2, and the next step is to find a way to measure OCP via the InPower APP, and affirm that ring position. Let’s go get some Marginal Gains. The Road Beckons! Watts Up!

Thanks for reading, and

ENJOY THE RIDE!

Share this:

  • Click to share on Facebook (Opens in new window) Facebook
  • Click to share on X (Opens in new window) X

Like this:

Like Loading...

Written by Richard Wharton · Categorized: Rotor Rings and Power Meters · Tagged: Bike Coach, Cycling Coach, mountain bike coach, Q Rings, Reno Cycling Coach, Reno Mountain Biking, Rotor 2InPower, Rotor InPower, Rotor Q Rings

Nov 14 2024

Vo2 at Threshold

Vo2 at Threshold – Affirming Outdoor Power at Threshold

Richard Wharton Vo2 at Threshold Online Bike Coach
Vo2 at Threshold can reveal a lot about how cardio-vascular fitness and status. The closer that number is to your Vo2Max, the better.

In my last blog post, I mentioned that for my best 10-minute effort while climbing a trail on a mountain bike, my Vo2 at Threshold read as roughly 55ml/kg/min. I also believed that my Vo2Max was roughly 62ml/kg/min. I was curious to see if these values were valid, so I went back indoors. At my home studio, I performed five weekly 20-minute efforts, specifically to determine whether those two values, Vo2 at Threshold, and Vo2Max, were accurate.


Percentage of Vo2Max When Cycling at Threshold Intensity

Different Metabolic Thresholds at a Percentage of Max Wattage
I’ve followed Jem Arnold for about a decade now, as he’s been involved in studying SmO2 for cyclists, as well as a lot of other things. This chart he presents, from a lecture, shows wide variation in ‘Thresholds’, where the body begins to migrate from mostly aerobic energy to anaerobic energy. This post is about Vo2 as a % of Max at Threshold.

There’s a lot of new information coming out about the determination of Training Zones. Essentially, each method of measurement tends to come up with its’ own value, and training zones are then based on those values. Let’s face it – Vo2 at Threshold is expensive to acquire, since it requires a Vo2Master, a Polar H10 chest strap, a Moxy, a Power Meter, and probably a Lactate Tester, which is a product I have owned in the past, but do not own at this time. Instead, I use the Moxy and other readings from the Vo2Master and my Polar H10 chest strap, to determine the most accurate Threshold value for myself.

By looking at ALL of the values, however, I could then apply each of them when training. If the goal is to raise Vo2Max to its’ highest time-limited potential, and to raise % of Vo2Max at Threshold, then having those other metric markers can help me take a more holistic approach to every ride.

The Workout

For these five tests (and probably counting), I used my standard indoor training software, PerfPro Studio. My warmup consisted of a 27-minute protocol that I’ve honed using Moxy muscle oxygen sensors. I did roughly four Vo2master O2 calibrations for each workout, but I only recorded the 20-minute effort on the Vo2Master app. The Vo2Master is best used in a consistent atmosphere, so I used a local 8000 btu air conditioner in my small room, to help keep humidity and temperature under control.

PerfPro Studio Vo2 at Threshold Workout
There’s literally no better piece of software in the cycling fitness world than PerfPro Fitness. The amount of information I can read, along with the myriad ways I can build workouts, remains unmatched.

Here are the results:

Date20Min Vo2 Average20Min Power Average20Min HR Average20Min RR Average20Min DFAA1 Average20Min SmO2 Average20Min EqO2 AverageBest 30-sec Vo2maxVo2 as a % of Max
6-Oct53.5271163350.56.822.262.685%
13-Oct55.1287172390.41524.560.691%
20-Oct57.5281170420.42024.565.288%
27-Oct56.9273172430.4310.225.363.290%
3-Nov56.9273172430.410.225.363.290%
AVERAGE55.98277169.840.40.42612.4424.3662.489%
HIGH57.5287172430.52025.363.291%
LOW53.5271163350.46.822.260.685%
RANGE416980.113.23.12.65%

What the Chart Says

There’s more information on this chart than just Vo2 values, but here’s the summary…

  • My 20-minute average Vo2 over 5 efforts was 56ml/kg/min. This is comparable to the 55ml/kg/min that was observed in the mountain bike climb from the previous, outdoor, post.
  • The highest 30-second Vo2 value over the same 5 efforts, which I’ll call Vo2Max, was 63ml/kg/min. Again – I’ve seen this ‘Vo2Max’ value enough to believe it is accurate. Incidentally, my Garmin 1040 and Garmin Connect continue to show my Vo2Max, per calculation only, at 59-60ml/kg/min, which I believe tracks pretty well, even though it is not using metabolic values, and instead uses calculations.
  • When you take the 20-minute Vo2 at Threshold, and divide it by the 30-second Vo2Max, well, my Vo2 at Threshold occurs at about 89% of my Vo2Max.

Notice that I have not mentioned power, or watts. I’ll explain why…

Vo2 at Threshold is a PHYSIOLOGICAL PHENOMENA

For 27 of my 31 years as a Professional Cycling Coach, pursuing watts at Threshold, watts at Vo2Max, and watts per kilogram per minute, has been a stated priority. However, Physics is immutable, while physiology is incredibly mutable.

For the same amount of physiological effort on the outdoor effort in the previous post, I averaged maybe 235 watts over 10 minutes, and 207 watts over 20 minutes. For these five indoor tests, I averaged about 277 watts over 20 minutes. The delta is too great to ignore.

On that same ride, I averaged 165 beats per minute for the climb, while on these five indoor rides, the average heart rate was 170 beats. Temperature, convection, and evaporation are important considerations for heart rate intensities.

For my climb outdoors, which was not 20 minutes, the average DFAA-1 on AlphaHRV was about a 0.4. For the 5 indoor efforts, it was 0.43. I am becoming more and more convinced that there is something ‘there’ there when it comes to DFAA-1 and Threshold.

Finally, the SMO2 value for my climb was about 25%, while the SMO2 average for the 5 indoor 20-minute efforts was 12.4%. I’m convinced that this is because of micro-recoveries on a mountain bike trail, vs. the consistent resistance of a 2% slope indoors.

I think I want to optimize my physiological markers going forward, and those of my clients, and let the watts take care of themselves from now on. Chasing watts as a primary metric, especially on a mountain bike, can leave a rider disillusioned and frustrated.

Conclusion

Vo2 at Threshold is a great way to assess your current fitness, but it requires expensive apparatus. I still don’t own all of the kit I could possibly wear that would help with this assessment. Knowing that my Vo2 at Threshold, is roughly 89% of my Vo2Max, does reassure me that my fitness, at least in August of 2024, and again in October of 2024, is pretty close to my genetic potential.

The next step, one I won’t attempt until the Spring of 2025, will be to try and grow that Vo2Max up to a 65, 66, or even 68ml/kg/min. This will be INCREDIBLY difficult to achieve as a 55-year old male, but I’d like to try. The next step would be to see if I can HOLD my Vo2 at Threshold near 90% as that Vo2Max rises. This is going to require losing another 2 kilograms of mass, maybe 3. That MAY affect my power output and fatigue levels, so I have to temper action with wisdom on this as we go into the 2025 PreSeason.

Winter is approaching quickly, and the cooler temps mean that I won’t be able to use the Vo2Master outdoors nearly as much. When the snow finally leaves the trails unrideable, I’ll be hyper focused on my indoor efforts in my VQ Velocity until Spring. But until then, I’ll be riding outside on the mountain bike on my beloved Peavine, trying to keep my singletrack skills and dreams alive until April 2025, when I can get back out there again.

I’ll post some follow up blogs about the other metrics featured in the chart above, but I need to consult with some PhD’s that are wiser than I am on these parameters. I also have to thank my client, Ken O’Brien, a retired Bell Labs professional, on his coding assistance for a new project that I’ll reveal next.

Thanks for reading, and ENJOY THE RIDE!


Share this:

  • Click to share on Facebook (Opens in new window) Facebook
  • Click to share on X (Opens in new window) X

Like this:

Like Loading...

Written by Richard Wharton · Categorized: Fitness, Mountain Biking, Moxy, PerfPro Training, Vo2 Master · Tagged: Bike Coach, Coach Richard Wharton, Coach Wharton, cycling, Cycling Coach, cycling fitness, mountain biking, Moxy, Peavine, PerfPro, Richard Wharton, Vo2 master, vo2master

  • 1
  • 2
  • 3
  • …
  • 19
  • Next Page »
  • Shop
  • Contact Us
  • What we do.
  • How we do it.
  • Why it works.
  • Who we are.
  • What you’ll need.
  • Let’s get started.
  • Blog
  • My account

Copyright © 2025 — Online Bike Coach • All rights reserved.

info@onlinebikecoach.com   |   (1) 214-616-9850   |     |  

  • Shop
  • Contact Us
  • What we do.
  • How we do it.
  • Why it works.
  • Who we are.
  • What you’ll need.
  • Let’s get started.
  • Blog
  • My account
%d