Online Bike Coach

Where Cyclists and Triathletes get Faster/Stronger/Leaner/Sooner

  • Shop
  • Contact Us
  • What we do.
  • How we do it.
  • Why it works.
  • Who we are.
  • What you’ll need.
  • Let’s get started.
  • Blog
  • My account

Feb 25 2023

Measuring HRV Stress with Garmin

Garmin HRV Stress Feature

Garmin HRV Stress Test
The Garmin HRV Stress Test might be a useful guide for daily cardiovascular exercise.

I believe that the Garmin HRV Stress measurement feature is completely under-utilized. Garmin has a LOT of features on their head units and watches that are underutilized. When Garmin purchased FirstBeat, the premier company that has studied Heart Rate Variability and its’ applications for health, I thought they would bring this information to the masses. Well, it’s there, but it’s still not well-promoted. This blog post is the first of many that I’m going to use to study HRV Stress, long-term.

What is HRV (Heart Rate Variability)?

I have been studying Heart Rate Variability since the early 2000’s, when the technology was paired with Suunto products. For years, Polar Oy was considered the leader in heart rate measurements, but the Suunto T6 really impressed me with how they used FirstBeat’s technology to explain cardio fitness. The distilled version of Heart Rate Variability is this;

“NO TWO BEATS ARE THE SAME.” 

A heartbeat is usually pegged to the ‘R’ wave, which is the contraction of the Left Ventricle. The original heart rate measurement looked at a rolling 6-second average of heart rate, to come up with a value, usually between 35 and 220. While we still use that measurement of exercise intensity, the more modern way is to look at the millisecond variation between each beat. When a heart is ‘happy’ or under little stress, it basically beats when it wants to. When a heart is under more stress from exercise intensity, the variability diminishes. The DELTA between beats, over time, is called the “Root Mean Square Standard Deviation”, or “RMSSD”. Heart Rate Variability (HRV) measures that Delta, and runs it through an algorithm based on FirstBeat’s Two-Plus Decades of Science and Publications. The solution, in this case, renders a ‘Score’ between 0 and 100, to assess an individual’s preparedness for exercise.

I have been a fan of a further evolution of this measurement via DFAA-1, but this measurement is about general health and wellbeing.

The Garmin HRV Stress Test

I use a Garmin 1030, but the Stress Test can be found in most of the modern Garmin head units and watches. You will need a chest strap, and honestly, a quiet place where you can stand still for 3 minutes. THERE SHOULD BE NO DISTRACTIONS. If the head unit or watch is set to send and receive messages or news clips, the test will fail. If you like soft music, headphones or earbuds might be appropriate. No kids, no pets. Just you, your head unit or watch, and a brief period of time.

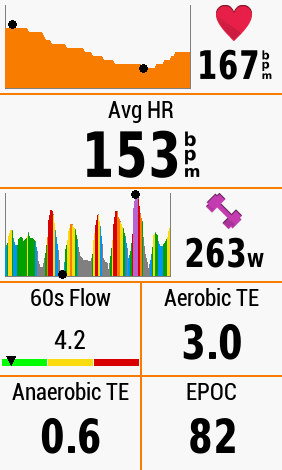
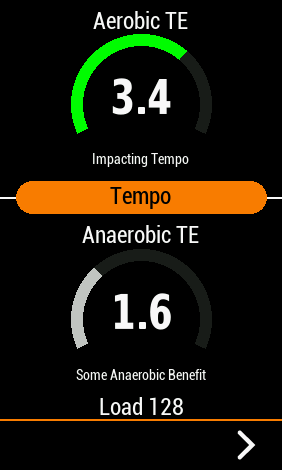
This video explains how I get to the HRV Stress Test feature on my particular Garmin. Once the test is over and I have a result, I usually take a screenshot of the results.

Results

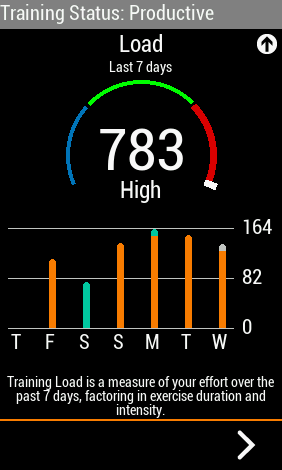
The goal with this series on the Garmin HRV Stress Test is to determine whether the HRV Stress Score corresponds to my fitness and training on the bike. The quick, short summary of the scores is like this: When the score is LOW, Garmin claims that you might have more success at a moderate or high intensity or high volume day. If the score is in the Medium Range, LSD or ‘Zone 2’ might be appropriate. If the score is HIGH, well, light exercise or no exercise is appropriate.

I intend to look at the ENTIRE Garmin Connect Ecosystem to determine my preparedness for exercise. This includes Garmin’s Sleep Score, the Body Battery, and even Garmin’s Hydration Tracker.

Why?

Because it’s all in one ecosystem via Garmin Connect. A combination of rugged wearables, head units, and software. Furthermore, I don’t think anyone has objectively followed these physiological measurements like this and presented them this way. The information has been there for years, but I honestly don’t know if the information is empirically valid or not. The science and the papers say ‘yes’, but the individual experience just has not been presented on the internet.

Let’s see where this information leads. Thanks for reading, and…

ENJOY THE RIDE!

Share this:

  • Click to share on Facebook (Opens in new window) Facebook
  • Click to share on X (Opens in new window) X

Like this:

Like Loading...

Written by Richard Wharton · Categorized: Fitness, Garmin Connect, Garmin Fields · Tagged: Bike Coach, Cycling Coach, Garmin, Garmin connect, HRV Stress, HRV Stress Test

Aug 22 2022

Garmin EPOC, Aerobic Training Effect, and Anaerobic Training Effect

EPOC, Aerobic TE and Anaerobic TE Are Great Fields to Help Measure Fitness

Aerobic TE, Anaerobic TE ,and EPOC
Sometimes it’s more fun to just ride, and get general ideas about fitness.

I’ve been using Garmin products since the early 2000’s. I love their adaptability, and their thorough approach to displays. Riders and runners love to complain about Garmin setup and use, but no other product is as complete or has so many features. EPOC is a cost-effective way to measure fitness and the results of a ride.

On July 1st, 2020, Garmin announced that they had purchased FirstBeat Technologies. This REALLY excited me, because I have studied FirstBeat since at least 2003. FirstBeat is a Finnish Company that has studied Heart Rate Variability (HRV), and how that applies to fitness. I’m currently working on HRV software through www.fitnesshrv.com, but that product is mostly designed around indoor use. For Cyclists, Runners and Swimmers who own Garmin head units and watches, we can use FirstBeat technology to gain insights into just how a ride is improving your fitness.

EPOC (Excess Post-Exercise Oxygen Consumption)

I first began studying EPOC in the mid 2000’s, when it was incorporated into the Suunto T6 fitness watch. I LOVED helping people in SPIN classes, who did not have access to wattage at the time, work on improving their fitness with this device. PUBLISHED SCIENCE shows that EPOC can help exercisers measure their efforts smarter. The TL:DR goes like this:

  • When you exercise, you stress the body.
  • The Frequency, Intensity, and Duration of the Stress (FIT) affects your heart, heart rate, and heart rate variability.
  • This stress leads to EPOC.
  • Garmin’s Training Load value serves as a “Score” for EPOC.
  • This Score can be used to modulate training. The Score also breaks down into Aerobic Training Effect and Anaerobic Training Effect.

Here’s a great link to a video that can further explain what’s going on.

EPOC Scores Lead to Aerobic TE and Anaerobic TE

In my zeal to measure all things PHYSICAL, I migrated from EPOC and Training Effect over the years, to wattage. But recently, I’ve been mountain biking a lot more, and I’m using EPOC with every ride. One of the most important aspects of all endurance exercise is finding the right balance between Aerobic Training Effect, Anaerobic Training Effect, and overall Volume. We don’t want to do too much, too often, but we do want to Progress and Periodize with the seasons.

FirstBeat defines Training Effect like this:

Training Effect (TE) represents the degree of homeostasis disturbance resulting from a session of physical activity. The Training Effect is based principally on EPOC values during exercise, which is further scaled based on the individuals fitness or activity level. The higher the TE-value the higher is also the expected increase in maximal performance after the exercise. EPOC (and TE) gets higher when either exercise intensity or duration is increased.

Training Effect describes the effect of exercise on a 0-5 scale:

0.0 – 0.9 = no effect
1.0 – 1.9 = minor effect (recovery training)
2.0 – 2.9 = maintaining effect
3.0 – 3.9 = improving effect
4.0 – 4.9 = highly improving effect
5.0 = temporarily overreaching effect

It is important to remember that a high TE is not needed in every exercise – for example doing an fitness-improving exercise session (TE e.g. 3.0) at least once a week combined with two weekly maintaining exercise sessions (TE e.g. 2.0) is enough to maintain (in trained individuals) or even improve (in sedentary individuals) the person’s aerobic fitness.

Every ride and every run will yield not just an EPOC value, but also an AEROBIC Training Effect, and an ANAEROBIC Training Effect. If you’re a mountain biker, wattage tends to be incredibly stochastic, and can be hard to interpret. Instead, if you follow my lead and add those fields to a profile page on your Garmin head unit or watch, you can observe and measure Training Effect instead!

EPOC becomes Training Load in Garmin Connect

If you own a Garmin Fitness device, you probably have a Garmin Connect account. Garmin Connect is FULL of great information! However, getting to the areas where you can assess fitness and start to understand how your training is affecting your performance, can be a little hard to find.

Try this:

  • Enter your username and password into Garmin Connect and go to the main page. It should look something like this:
Garmin Connect Dashboard Page - Hard to find EPOC in here...
The Garmin Connect Dashboard Page can be a little confusing. Lots of good information, but crowded and hard to find exactly what you’re looking for. Hard to find EPOC in here…
  • Now move your mouse to the area on the left titled “REPORTS”.

Click on “Cycling”, and “Training Status”. That SHOULD bring you to a page that looks something like this:

Garmin Reports Training Status Page
Garmin’s Training Status Page. This page will help you better understand just what your EPOC, Aerobic TE, and Anaerobic TE are doing for your fitness.
  • Let’s start at the “STATUS” area of Yellow, Orange, and Green blocks. Mousing over the blocks shows you whether the day’s work was ‘Productive’ (Green), ‘Unproductive’ (Orange), or ‘Maintaining’ (Yellow). Purple is ‘Peaking’, and black means you’re in a state of ‘Detraining’.
  • The next graph shows ‘Vo2 max’. Now, this is important. This is an ESTIMATION of Vo2. It is NOT ALWAYS all that accurate. I’ve had it be SPOT-ON, and I’ve had it be off by as much as 5 points. I’m not going to argue the merits of the claim here, but the important thing to focus on is whether that value is IMPROVING or not, and if not, why. Here’s a video link showing a man and a woman performing Vo2 max tests in a lab, and comparing those values to the Garmin Firstbeat data. The important thing to remember is that the Vo2max values are a FEATURE that comes from EPOC and Training Effect.

Next, let’s look at Exercise Load.

Garmin Exercise Load Graph
Garmin Exercise Load defaults to blue, but when you mouse over it, you get EPOC, as well as a colored breakdown of Training Effect.

Now, look at the colors, as well as the scale for this chart. It’s revealing our DAILY EPOC value from rides, as well as the Training Effect Breakdown. Most of my recent rides have been aerobic in nature, as I regain some fitness after a haywire heart concern that affected my ability to recover and sleep. If you look about five rides back from the right, you’ll see a bar that is both Orange and Purple. That was a High Intensity day, with an EPOC near 130. This is what the summary looked like on the Garmin head unit, after the ride.

Garmin Head Unit Post-Ride Aerobic and Anaerobic Training Effect Summary
The harder the terrain, the more power you need to generate. The more power you generate, the more Anaerobic the benefit. EPOC at 128 breaks down based on HRV data, to a 3.4 Aerobic TE (impacting aerobic Tempo), and 1.6 Anaerobic TE, which yielded a bit of improvement on those switchback climbs.

Finally, and perhaps most importantly, take a look at the graph on the page that shows 7-day Training Load.

Garmin Connect 7-day Training Load
The 7-Day Training Load shows the Accumulated EPOC for an individual. The black dots are the mathematical sum, the Green band is a form of Artificial Intelligence that provides a SUGGESTED EPOC value, as it relates to your recent, empirical, and goal history.

When you’re cycling through a post-ride summary, the Training Load value looks like this on your Garmin head unit.

Garmin Connect 7-day Training Load shows accumulated EPOC
The Garmin head or watch unit can provide a general sense of training status productivity. Right now, my status is “High”, because I’m intentionally overreaching on my chronic fitness, to get to a point where I can start considering HiiT intervals again, which should raise my Vo2max, as well as my Anaerobic Training Effect. EPOC for the last 7 days reads 783.

Training Effect and EPOC recommendations

The Published Science on FirstBeat’s claims shows that the values can guide users to greater gains, without further investments in expensive products. Let’s face it – these products are never cheap, and there’s always a push for more hardware integration. We can achieve this with Garmin’s NIRS technology, as well as their chest straps. The accuracy may not be as precise as a watt-meter, but it may not always be necessary to measure every Newton-Meter or KiloJoule, etc.

In general terms, try this:

  1. BE CONSISTENT. Ride, run, or swim for an EPOC of between 100 and 150 points. Use those numbers for a few weeks, and then compare them to the SUGGESTIONS on the Garmin Connect 7-day Training Load chart.
  2. VARY your Aerobic Training Effect and Anaerobic Training Effect. There ARE SUGGESTIONS for these values as well. There’s a hidden page that can show your Load Focus as it compares to the ‘Optimal Range’ Recommendations. I have been riding between a 3.0 and a 4.0 on the Aerobic Training Effect, and a 0 to 2.0 on the Anaerobic Training Effect. That will change with my fitness and my needs, but it follows my own acronym of ‘SMART’ (Specific, Measurable, Achievable, Repeatable, and Timely). It also allows me to study my Mountain Bike suspension instead of my fitness. Maybe some day I’ll even be able to merge the two, though it’s probably too late for that this year

Here’s how to get to the LOAD FOCUS OPTIMAL RANGE PAGE.

  • In the ‘Reports’ page, scroll to the top and look for ‘TRAINING STATUS’. Below that, you’ll find a row of information. Look for ‘LOAD FOCUS’. Click on the BLUE SCRIPT, and you’ll get something that looks like this:
    Garmin Reports Training Status Load Focus Area
    On the “Reports” page, scroll to the top, find ‘Load Focus’, and click on the Blue Text. Mine currently says “Above Targets”, but yours may say something different, depending on fitness, frequency, and goals.


  • You’ll end up with a page that looks like this:
    Load Focus 7-Day Graphic Values vs Optimal Values
    Notice that the OPTIMAL RANGE recommendations are within the dotted line. The values show the EPOC points for each zone over 7 days, and when you mouse over the QUESTION MARK, you get an explanation of just what those values achieve in terms of Cardio-Vascular fitness.


EPOC 100-150, Aerobic TE of 3-4, and Anaerobic TE between 0.5 and 2.0

Try it for about six weeks and tell me what you think. I’ll investigate more intensity once I get a solid aerobic base under my legs, maybe a 7-day training load of about 1100 or more, and then see what the HiiT intervals tell me.

Like what you are reading? Support this article and more!

Share this:

  • Click to share on Facebook (Opens in new window) Facebook
  • Click to share on X (Opens in new window) X

Like this:

Like Loading...

Written by Richard Wharton · Categorized: Garmin Connect, Garmin Fields, Mountain Biking · Tagged: Aerobic Training Effect, Anaerobic Training Effect, EPOC, Garmin, Garmin connect

Jan 08 2022

Billat 30-30’s – Part Two

"Billat 30-30's are intervals that require a hard effort for 30 seconds, followed by an easy recovery for 30 seconds. Over time, the body ends up playing 'catch-up', through heart rate, breath frequency, demand for oxygen at the muscular level, and a buildup of lactate in the system.  We can see this buildup through lactate testing, which is invasive and cumbersome, but we can also see it through SmO2 values, as muscles de-saturate and re-saturate. Lactate is getting processed back into energy, but sometimes the demand for oxygen is greater than the body's ability to provide it. "
Become a subscriber and get access to this post and our entire coaching library, all for less than the cost of a movie ticket. Click here to learn more.

Already a subscriber? log in

Written by Richard Wharton · Categorized: Moxy, PerfPro Training, Vo2 Master · Tagged: Bike Coach, Billat, Garmin, Moxy, Peavine, PerfPro, Reno Bike Coach, Reno Cycling, Reno Cycling Coach, Reno Mountain Biking, SmO2, vo2master

Dec 24 2021

The Road to 300 Watts FTP

Right Now, It's NOT about 300 Watts; It's About Raising LOWER THRESHOLD

The goal of base is to train the body for Economy. Stamina is the fundamental Pillar for Polarized Training. When you train using DFAA-1, you can get a clearer picture of how your body is responding to the training. Wattage and traditional heart rate become
Become a subscriber and get access to this post and our entire coaching library, all for less than the cost of a movie ticket. Click here to learn more.

Already a subscriber? log in

Written by Richard Wharton · Categorized: DFAA1, Fitness, Moxy, PerfPro Training, Runalyze, Vo2 Master · Tagged: Bike Coach, Cycling Coach, FatMaxxer, Garmin, Garmin connect, Moxy, Moxy Monitor, PerfPro, PerfPro Studio, Polar H10, Reno Bike Coach, Reno Cycling Coach, Runalyze, Vo2 master, vo2master

Oct 20 2021

More DFAA1 Files From Myself and my Clients

My Own Sleep Was Not Great, But Things On the Cardio Side Are Really Looking Good

Well, once again, I didn’t sleep great last night. I woke up around 1:00am, and was up for about an hour. There is stress at the house with a relative, and that may have contributed. Last night, however, I woke up with a really hot lumbar area. It may have been the electric blanket my wife uses on cold evenings. It may have been her snoring. I’m just not sure.

What I continue to notice is that my DEEP sleep is weighted in the first few hours of the night, and my REM sleep mostly occurs after I’ve fallen asleep for the second time. I can continue to try and change this, or I can possibly adapt. We’ll see what the trend shows over recorded time.

DFAA1 Rides Are Showing Results

What I am perhaps more excited to share are a few of my overnight results from clients who are riding DFAA1 rides for Base training. DFA-A1 stands for: “Detrended Fluctuation Analysis – Alpha 1”. Alpha-1 means “Short Term Exponent”. Recent research by noted professionals Marco Altini, Dr. Bruce Rogers, Ian Peake, and others, has highlighted that a DFAA-1 ABOVE 0.75, yields a healthier aerobic adaptation, and time spent between 0.75 and 0.99, per FatMaxxer and HRV Logger (both apps you can download for your phone), optimize the intensity where fat is consumed as fuel.

I’m planning on staying on the DFAA-1 program for several more weeks, as are most of my clients in the Northern Hemisphere. To A PERSON, they are seeing growth trends  in HR for the same DFAA-1, improved wattage, better recovery, and better discipline from the focus. Personally, I’d like to see this technology incorporated in to PerfPro Studio and Analyzer, as well as the Vo2master software.


And if you like what you see, please feel free to buy me a Cup of Coffee!

Share this:

  • Click to share on Facebook (Opens in new window) Facebook
  • Click to share on X (Opens in new window) X

Like this:

Like Loading...

Written by Richard Wharton · Categorized: DFAA1, Fitness, Garmin Connect, Runalyze · Tagged: Bike Coach, Cycling Coach, cycling fitness, DFA-a1, DFAa-1, DFAa1, Garmin, Garmin connect, Peavine, Reno Bike Coach, Reno Cycling, Reno Cycling Coach, Reno Mountain Biking, Runalyze

  • « Previous Page
  • 1
  • 2
  • 3
  • 4
  • 5
  • 6
  • …
  • 10
  • Next Page »
  • Shop
  • Contact Us
  • What we do.
  • How we do it.
  • Why it works.
  • Who we are.
  • What you’ll need.
  • Let’s get started.
  • Blog
  • My account

Copyright © 2025 — Online Bike Coach • All rights reserved.

info@onlinebikecoach.com   |   (1) 214-616-9850   |     |  

  • Shop
  • Contact Us
  • What we do.
  • How we do it.
  • Why it works.
  • Who we are.
  • What you’ll need.
  • Let’s get started.
  • Blog
  • My account
%d